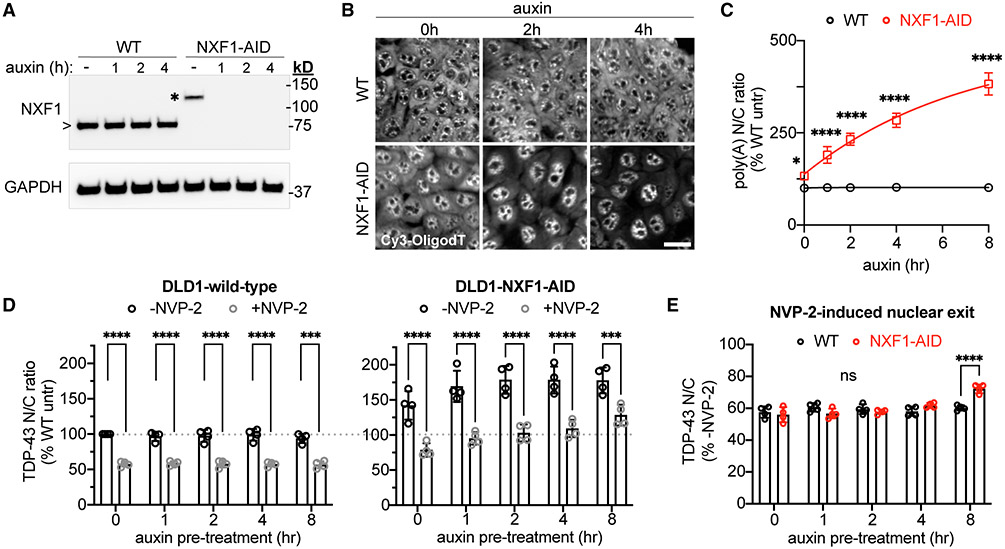
Figure 3. Acute NXF1 ablation does not alter NVP2-induced TDP-43 nuclear export.
(A) NXF1 immunoblot in DLD1-wild-type versus NXF1-AID cells treated with 0.5 mM auxin for 0–4 h. Note the increased molecular weight for AID-tagged (*)versus endogenous NXF1 (>).
(B) PolyA-FISH (Cy3-OligodT(45)) in DLD1-wild-type versus NXF1-AID cells treated with 0.5 mM auxin. Scale bar, 25 μm.
(C) PolyA-RNA N/C shown as percentage of wild-type untreated cells.
(D) TDP-43 N/C in DLD1-wild-type cells (left) and NXF1-AID cells (right) pretreated with 0.5 mM auxin for 0–8 h, followed by 2 h auxin ± 250 nM NVP2. Data in both panels are normalized to untreated DLD1-wild-type cells (dotted line).
(E) TDP-43 N/C in NVP2 treated versus untreated cells in DLD1-wild-type (black) versus NXF1-AID (red) cells. These are the same data as (D), adjusted for differences in the steady-state TDP-43 N/C ratio to permit comparison of NVP2-induced TDP-43 nuclear exit.
In (C), (D), and (E), mean ± SD is shown for >3,000 cells/well in four biological replicates. ns, not significant; ***p < 0.001, ****p < 0.0001 by two-way ANOVA with Sidak’s test.

