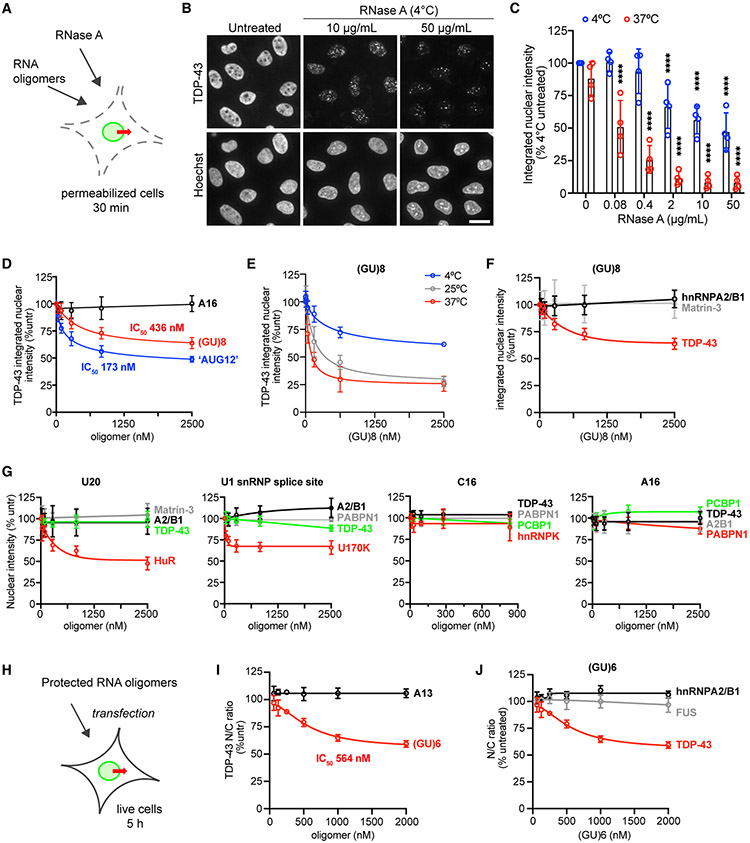
Figure 4. RNase and GU-rich oligomers induce TDP-43 nuclear efflux.
(A) Addition of RNase A or RNA oligomers to the permeabilized cell TDP-43 passive export assay.
(B) TDP-43 IF (top) and Hoechst (bottom) in permeabilized HeLa cells incubated for 30 min at 4°C ± RNase A. Scale bar, 25 μm.
(C) TDP-43 integrated nuclear intensity in permeabilized HeLa cells incubated for 30 min at 4°C versus 37°C ± RNase A. Data are normalized to untreated cells kept at 4°C. ****p < 0.0001 versus untreated by two-way ANOVA with Tukey’s test. See also Figure S5.
(D) TDP-43 integrated nuclear intensity (percent untreated) in permeabilized HeLa cells incubated for 30 min at 4°C with A16, (GU)8, or “AUG12.”
(E) TDP-43 integrated nuclear intensity (percent untreated) in permeabilized HeLa cells incubated at 4°C, 25°C, or 37°C for 30 min with (GU)8.
(F) Integrated nuclear intensity of nuclear RBPs (percent untreated) in permeabilized HeLa cells incubated for 30 min at 4°C with (GU)8. Note that TDP-43 data are the same as in (D).
(G) Integrated nuclear intensity of nuclear RBPs (percent untreated) in permeabilized HeLa cells incubated for 30 min at 4°C with the indicated oligomers.
(H) Transfection of live HeLa cells with protected RNA oligomers.
(I) TDP-43 N/C (percent untreated) 5 h post transfection with protected A13 or (GU)6.
(J) RBP N/C (percent untreated) 5 h post transfection with protected (GU)6. Note that TDP-43 data are the same as the (GU)6 data in (I).
In (F), (G), and (J), RBP in red is the most closely predicted binding partner for that motif, green is moderately similar, and gray and black denote no or low predicted binding. In (C) to (J), mean ± SD is shown for >2,000 cells/well in 3–4 biological replicates. IC50 was calculated by non-linear regression. See Table S1 for oligomer sequences.

