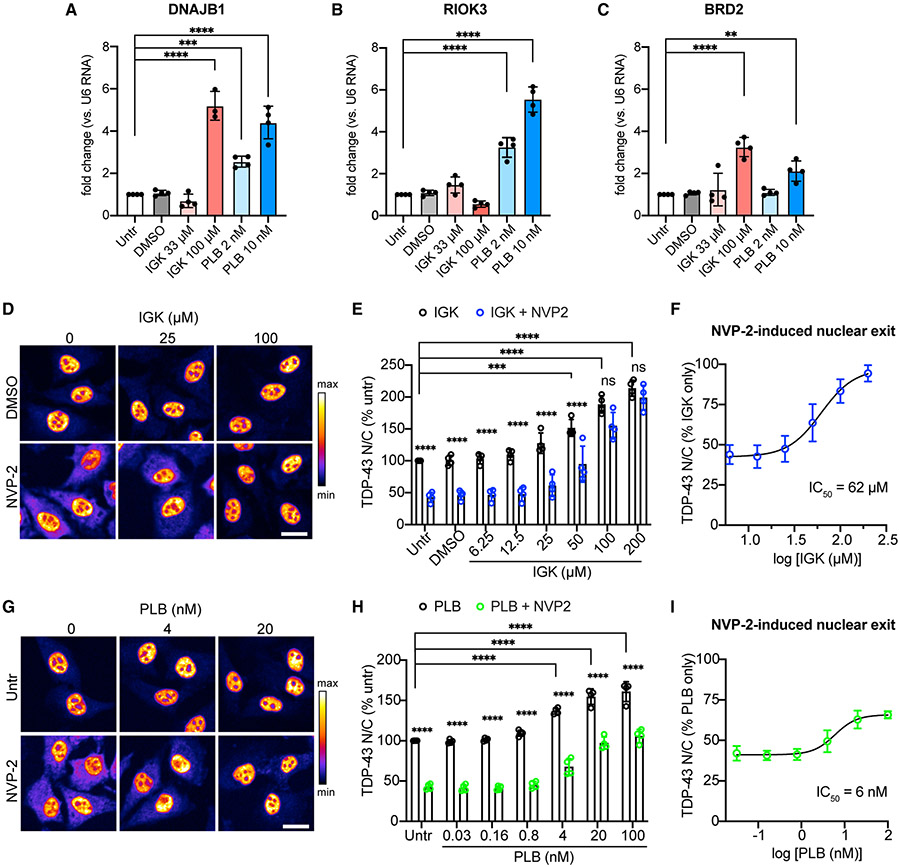
Figure 5. Inhibition of pre-mRNA splicing promotes TDP-43 nuclear accumulation.
(A–C) qRT-PCR quantification of DNAJB1 (A), RIOK3 (B), and BRD2 (C) introns, normalized to U6 small nuclear RNA in HeLa cells treated for 4 h with IGK or PLB. Mean ± SD is shown for four biological replicates. A single outlier was removed from IGK at 100 μM (fold change 18.78) via Grubbs test (α = 0.05). **p < 0.01, ***p < 0.001, ****p < 0.0001 by one-way ANOVA with Dunnett’s test.
(D) TDP-43 IF in HeLa cells treated with IGK for 4 h, followed by 2 h ± 250 nM NVP2. Scale bar, 25 μm.
(E) TDP-43 N/C (percent untreated) in IGK or IGK + NVP2-treated cells.
(F) TDP-43 N/C (same data as B) shown as percentage of IGK only to permit comparison of NVP2-induced nuclear exit. IC50 Was calculated by non-linear regression.
(G) TDP-43 IF in HeLa cells treated with PLB for 4 h, followed by 2 h PLB ± 250 nM NVP2. Scale bar, 25 μm.
(H) TDP-43 N/C (percent untreated) in PLB or PLB + NVP2-treated cells.
(I) TDP-43 N/C (same data as E) shown as percentage of PLB only, to permit comparison of NVP2-induced nuclear exit. IC50 was calculated by non-linear regression.
In (D) and (G), the intensity histogram for each image was independently maximized across the full range and a pseudo-color LUT was applied. In (E), (F), (H), and (I), mean ± SD of >2,000 cells/well in four biological replicates. ns, not significant; ***p < 0.001, ****p < 0.0001 by two-way ANOVA with Tukey’s test. See also Figure S6.

