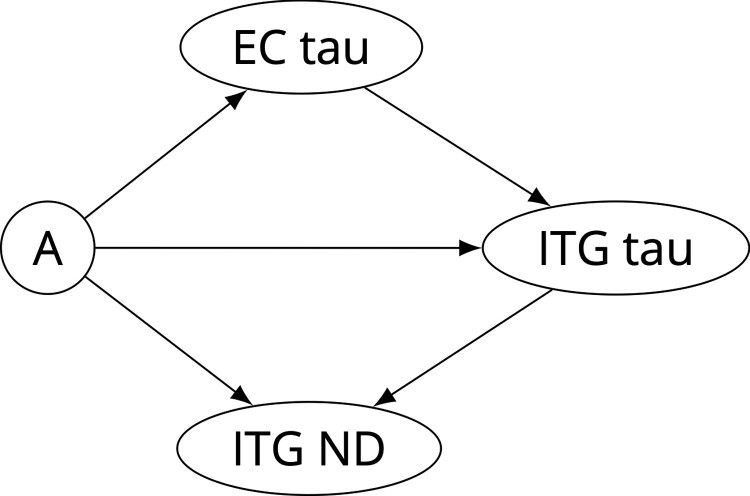
Figure 1.
Directed acyclic graph representing the causal model for amyloid (A), tau, and neurodegeneration (ND). As ND measures, we investigated cerebral blood flow (in the BLSA only), glucose metabolism (in the ADNI only), and regional volume. Common covariates for all four nodes (not shown in Figure) include age, sex, APOE ε4 positivity, education, and 10-year cardiovascular disease risk.

