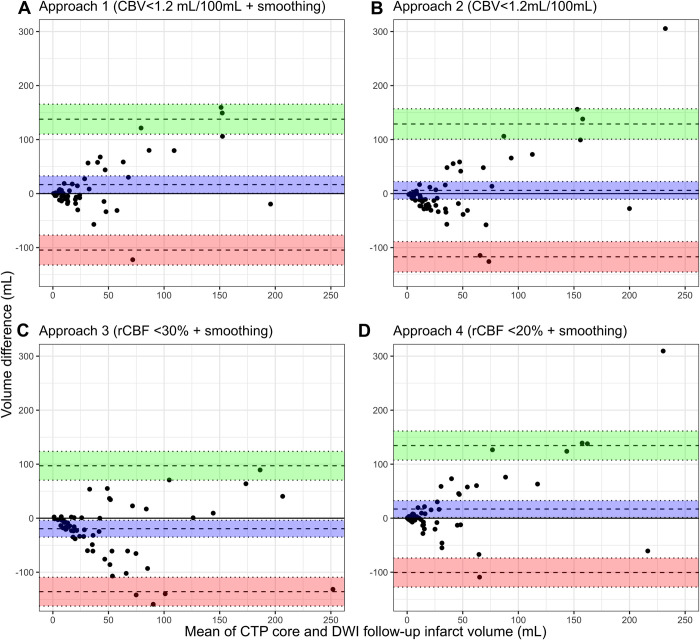
Fig 2.
Bland-Altman plots comparing the estimated CTP ischemic core volume and DWI follow-up infarct volume for (a) approach 1, (b) approach 2, (c) approach 3, and (d) approach 4. The mean bias (blue), lower (red) and upper (green) Limits of Agreement are shown with 95% confidence intervals. The bias with 95% confidence intervals is shown in blue. Negative values indicate overestimation by CTP. CTP = CT perfusion; DWI = diffusion weighted imaging.

