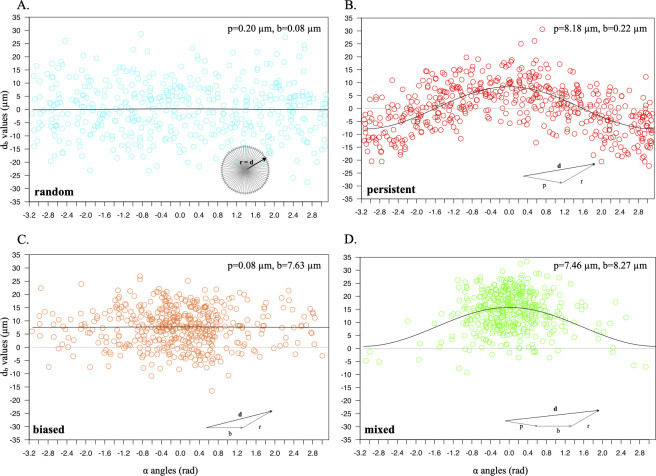
Fig 2. Persistence and bias effect on directional component of cell movement.
The directional components of cell displacements from cell populations are plotted (y axis) against their α angles (x axis); (A, B) correspond to populations generated by simulating random (p = 0 μm; b = 0 μm), persistent (p = 8 μm; b = 0 μm), biased (p = 0 μm; b = 8 μm) and mixed movements (p = 8 μm; b = 8 μm). The continuous line corresponds to curves identified by fitting the described model to the data; the numerical parameters are shown on the top of each graph.

