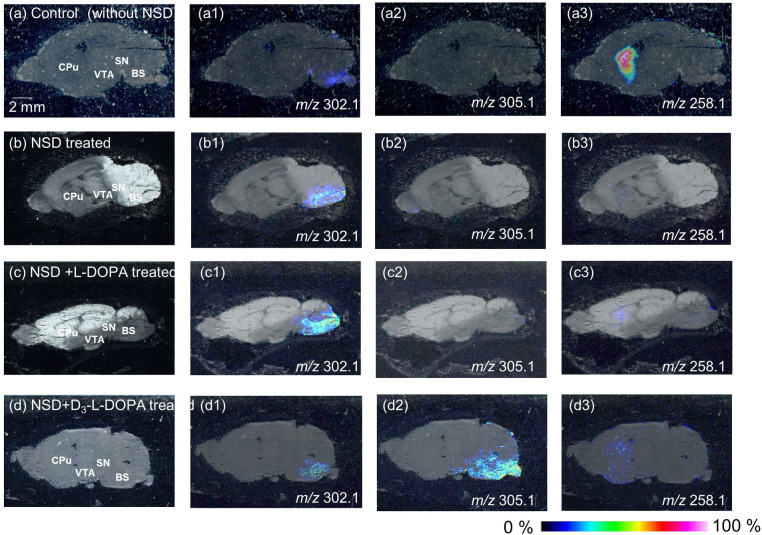
Fig 2. Derivatized imaging mass spectrometry of catechol amines.
Optical image of sagittal section from mouse brain saline-treated as control (a), NSD-1015-treated (b), NSD1015 and L-DOPA-treated (c) and NSD1015 and D3-L-DOPA-treated (d) mouse. MS spectra reconstructed image of L-DOPA (a1, b1, c1 and d1), D3-L-DOPA (a2, b2, c2 and d2) and DA (a3, b3, c3 and d3), BS, brain stem. MY, medulla; OB, olfactory bulb; P, Pons.

