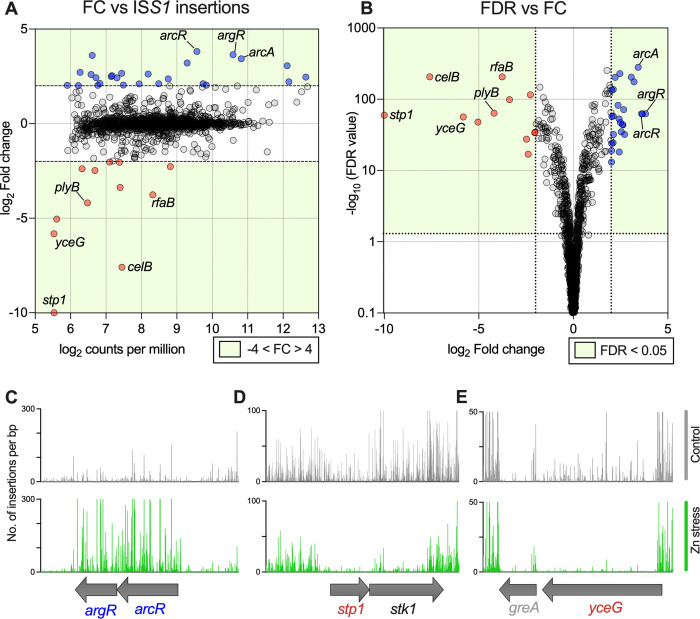
Fig 10. Defining the Zn stress resistome of GBS to identify novel factors in bacterial responses to Zn intoxication.
A super-saturated ISS1 GBS insertion library was subjected to Zn stress and compared to control incubation without Zn to define the Zn resistome. Transposon-directed insertion sequencing (TraDIS) identified 26 genes over-represented (blue) and 12 under-represented (red) during Zn stress. Plots showing Fold change (FC) of each gene compared to number of ISS1-insertions per million reads mapped (A) and false discovery rate (FDR; q-value) compared to fold change (B), with green shading indicating genes that satisfied cutoffs as indicated (fold-change ±4; FDR < 0.05). Illustrative read-mapping of ISS1 insertion sites (C-E) displaying differences between non-exposed control (grey) or Zn stress conditions (green) for selected genes; over-represented argR/arcR (C) and under-represented stp1/stk1 (D) or yceG (E). Vertical lines in C-E represent pooled read counts at each base within each locus, with coding sequences of genes represented by grey arrows beneath. Data are compiled from 3 independent experiments. FDR values (Y) were displayed by -log10 (Y) transformation followed by plotting on a log10 y-axis to generate volcano plot (B).

