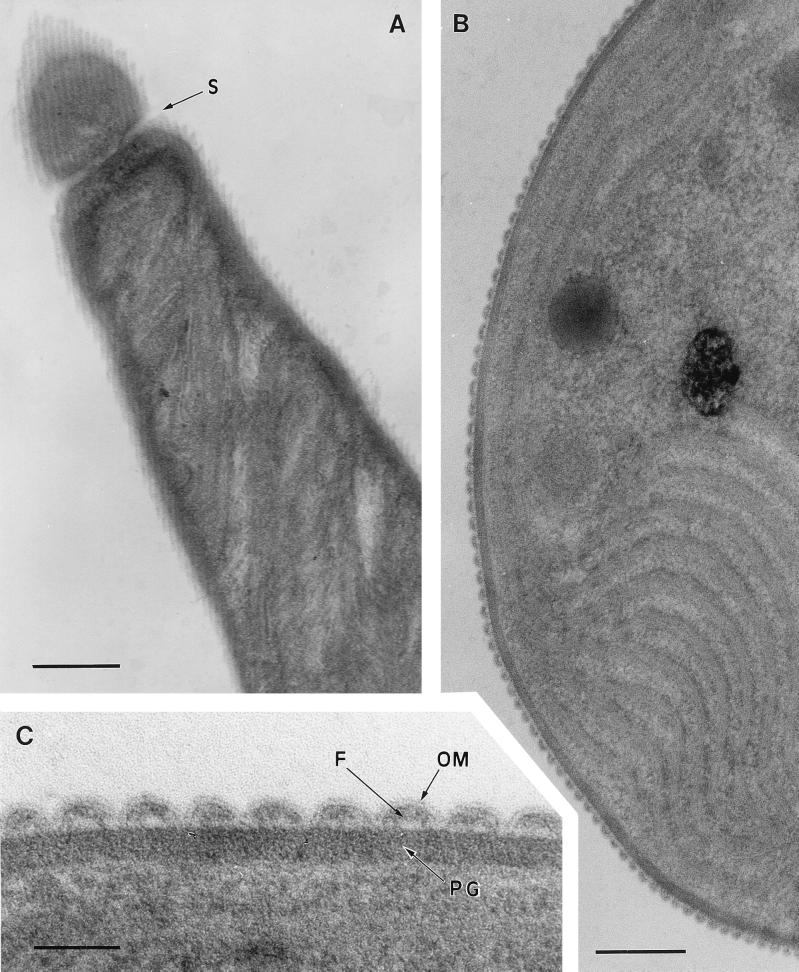
FIG. 1.
Transmission electron micrographs of thin sections of Oscillatoria sp. strain FT2 filaments. (A) Longitudinal section. At the top of the figure, beyond a cell septum (S), the section has grazed the surface of the filament, revealing an array of parallel fibrils running at an angle of approximately 25 to 30° to the filament’s long axis. Bar, 400 nm. (B) Part of a transverse section, showing an end view of the fibrillar array in the cell wall. Bar, 200 nm. (C) Enlarged view of part of panel B, showing the double line of the outer membrane (OM) covering the fibrillar array and dipping between adjacent fibrils (F) to contact the electron-dense peptidoglycan layer (PG). Bar, 50 nm.

