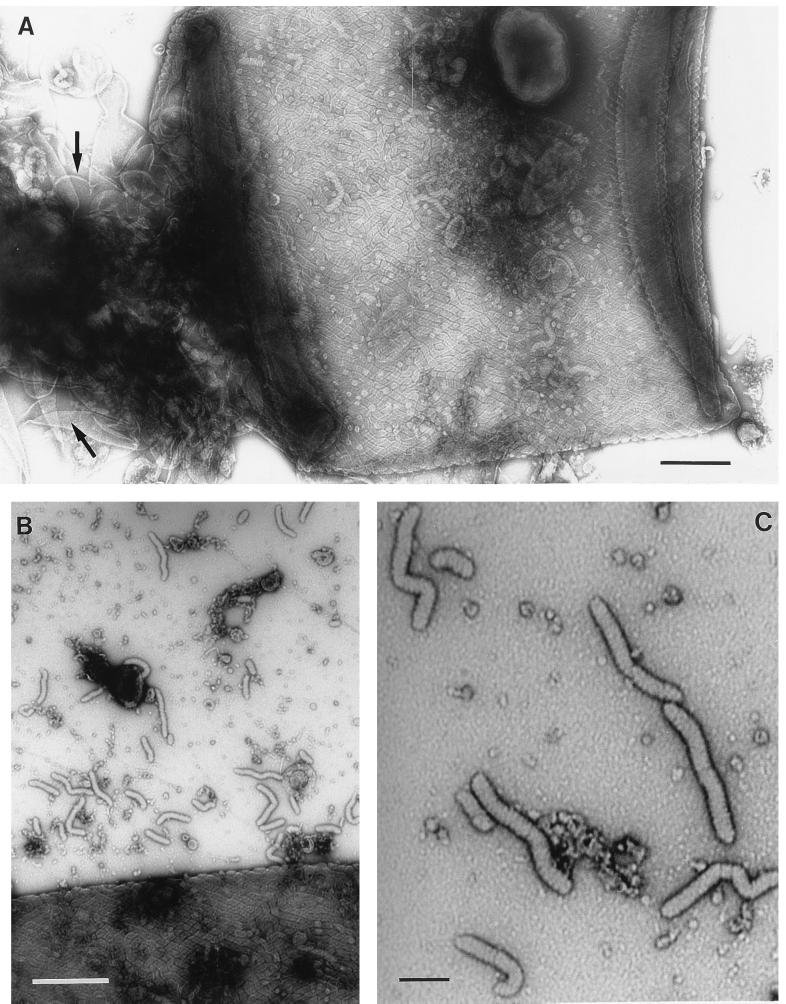
FIG. 3.
(A and B) Transmission electron micrographs of Oscillatoria sp. strain A2. Actively motile samples were crushed between glass slides and negatively stained. (A) Although an intact fibrillar array covering the cell can be seen, the crushing process has caused damage to the cell wall, leaving some areas (arrows) completely free of fibrils. Some of the fibrils released in this process can be seen in panel B, and some of them show possible evidence of a substructure (C). Bars, 400 nm (A and B) and 100 nm (C).

