
FIGURE 1.
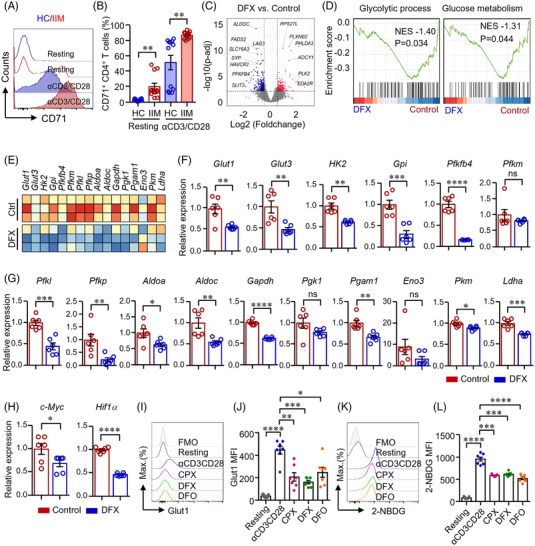
Iron chelation suppressed glucose metabolism in CD4+ T‐cells. (A and B) CD4+ T‐cells from patients with idiopathic inflammatory myopathies (IIM) or healthy controls (HC) were stimulated with anti‐CD3/CD28 beads for 72 h. Cells were then stained with PE conjugated antibody against CD71 and measured by flow cytometry. Representative histograms were shown. Data from 12 independent samples (dermatomyositis [DM] = 9; polymyositis [PM] = 3). (C)–(E) CD4+ T‐cells from HC were stimulated with anti‐CD3/CD28 beads in the presence of absence of deferasirox (DFX, 1 μM) for 72 h. Bulk RNA‐sequencing (RNA‐seq) derived from DFX‐treated and control CD4+ cells was performed to screen for differential express genes (DEGs) and enriched gene sets. (C) Volcano plot for DEGs. (D) Gene sets showing the enrichment scores of glycolytic process and glucose metabolism. (E) Heat map of genes for glycolysis derived from bulk RNA‐seq data (n = 3). (F)–(H) Gene expression of glucose transporter 1 (Glut1), Glut3, hexokinase (Hk)2, Gpi, Pfkfb4, Pfkm, Pfkl, Pfkp, Aldoa, Aldoc, Gapdh, Pgk1, Pgam1, Eno3, Pkm, Ldha, c‐Myc and Hif1α were measured by quantitative real‐time PCR (qPCR). Data were shown as fold change to control group (n = 6). (I)–(L) CD4+ T‐cells from HC were stimulated with anti‐CD3/CD28 beads for 72 h. Ciclopirox (CPX, 1 μM), DFX (1 μM) and deferoxamine (DFO, 2 μM) were included as indicated. (I and J) CD4+ T‐cells were stained with Alexa Fluor 647 conjugated antibody against Glut1 and measured by flow cytometry. Data taken from seven independent samples. (K and L) CD4+ T‐cells were incubated with 2‐NBDG (glucose analogue), and glucose uptake was accessed by flow cytometry for the uptake of 2‐NBDG. Mean fluorescence intensity (MFI) is shown. Data from seven independent samples. Data are mean ± SEM. *p < .05, **p < .01, ***p < .001 and ****p < .0001 by Student's t‐test in panels (B), (F), (G), (H) and one‐way ANOVA in panels (J and L) followed by adjustments for multiple comparisons. ns, not significant.