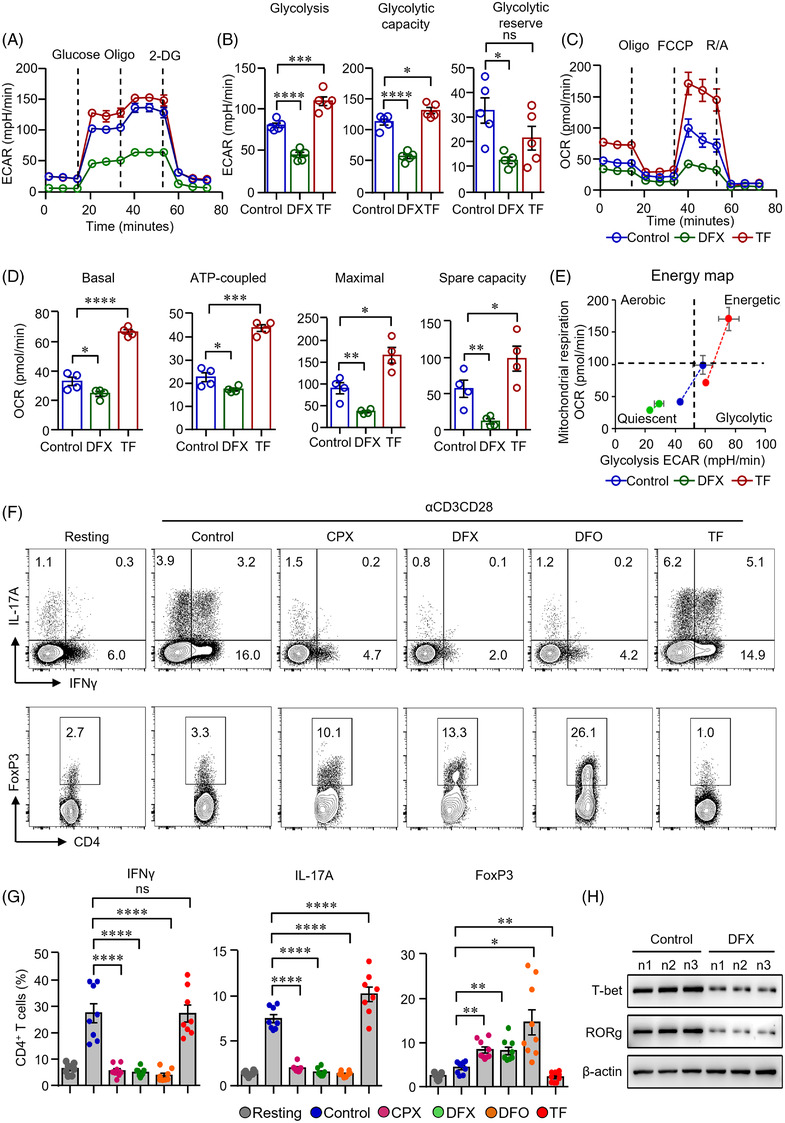
FIGURE 2.

Iron chelation inhibited metabolic activities and modulated the differentiation of CD4+ T‐cells. (A)–(E) CD4+ T‐cells isolated from healthy controls (HC) were stimulated with anti‐CD3/CD28 beads for 3 d. Ciclopirox (CPX) (1 μM), deferasirox (DFX) (2 μM), deferoxamine (DFO) (2 μM) and transferrin (TF, 50 μg/ml) were included in some of the experiments as indicated. For metabolic activities evaluation of CD4+ T‐cells, Glycolysis Stress Test Kit and Mito Stress Test Kit were used to test extracellular acidification rate (ECAR) and oxygen consumption rate (OCR), respectively, by a Seahorse XF96 analyser. (A and B) Glucose, oligomycin (Oligo) and 2‐deoxyglucose (2‐DG) were injected sequentially and ECAR were recorded. ECAR tracing curves and parameters of glycolysis, glycolysis capacity and glycolysis reserve were summarized (n = 5). (C and D) Oligo, carbonyl cyanide‐p‐trifluoromethoxyphenylhydrazone (FCCP) and rotenone/antimycin A (R/A) were injected sequentially. OCR of basal respiration, respiration coupled to ATP production, maximal respiration and respiratory spare capacity were summarized from four independent samples. (E) Energy map showing metabolic potential of CD4+ T‐cells. (F and G) CD4+ T‐cells were stimulated with anti‐CD3/CD28 beads in the presence of CPX (1 μM), DFX (2 μM), DFO (2 μM) and TF (50 μg/ml) for 5 d. CD4+ T‐cells were stained with Brilliant Violet 421‐conjugated anti‐interferon gamma (IFNγ), APC‐conjugated anti‐interleukin (IL)‐17A and PE‐conjugated anti‐FoxP3 antibodies. Data were acquired by flow cytometry. Representative counter plots were shown and data from eight independent samples. (H) CD4+ T‐cells from HC (n) were stimulated with anti‐CD3/CD28 beads in the presence or absence of DFX (2 μM) for 5 d. T‐bet and RORg expression was measured by western blot (n = 3). All data are mean ± SEM. *p < .05, **p < .01, ***p < .001 and ****p < .0001 by one‐way ANOVA followed by adjustments for multiple comparisons.
