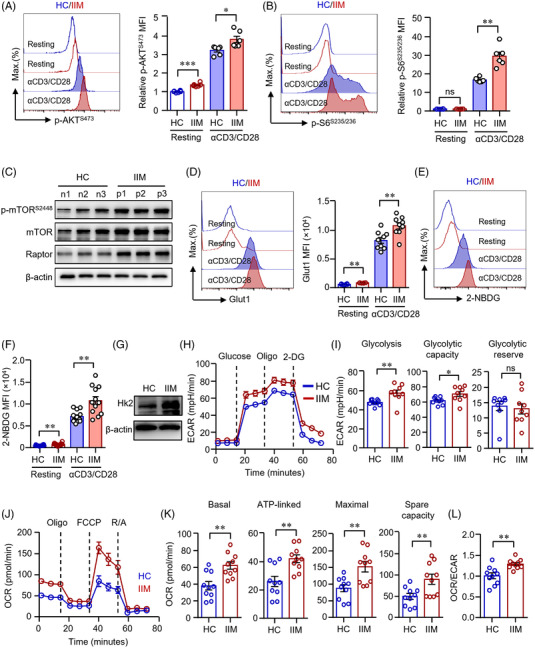
FIGURE 3.

CD4+ T‐cells from patients with idiopathic inflammatory myopathies (IIM) showed enhanced glucose metabolism. CD4+ T‐cells isolated from patients with IIM or healthy controls (HC) were stimulated with anti‐CD3/CD28 beads for 72 h. (A and B) Phosphorylation of AKT (p‐AKT) and p‐S6 (ribosomal protein) were measured by flow cytometry (dermatomyositis [DM] = 3, polymyositis [PM] = 3). (C) Expression of phosphorylation of mTOR (p‐mTOR), mTOR and Raptor in CD4+ T‐cells from IIM patients (p) or HC (n) was measured by western blot. Representative bands are shown (n = 3). (D) CD4+ T‐cells were stained with Alexa Fluor 647‐conjugated antibody against glucose transporter 1 (Glut1) and measured by flow cytometry. Mean fluorescence intensity (MFI) of Glut1 was summarized from nine independent samples (HC = 9, DM = 6, PM = 3). (E and F) CD4+ T‐cells were incubated with 2‐NBDG and glucose uptake were evaluated by flow cytometry. MFI of 2‐NBDG was summarized (HC = 12, DM = 8, PM = 4). (G) Hexokinase (Hk)2 expressions in CD4+ T‐cells were quantified by western blot. Representative bands of three independent samples. (H)–(L) Glycolytic activities of extracellular acidification rates (ECARs) and mitochondrial activities of oxygen consumption rate (OCR) in CD4+ T‐cells were measured using a Seahorse XF96 analyser as in Figure 2. (H and I) ECAR tracing curves and parameters of glycolysis, glycolysis capacity and glycolysis reserve were summarized (HC = 9, DM = 6, PM = 3). (J and K) OCR tracing curves and parameters of mitochondrial function: basal respiration, respiration coupled to ATP production, maximal respiration and respiratory spare capacity were summarized in (K). (L) Ratio of OCR to ECAR. Data from 10 independent samples (HC = 10, DM = 6, PM = 4). All data are mean ± SEM. *p < .05, **p < .01, ***p < .001, ****p < .0001 by Student's t‐test. ns, not significant.
