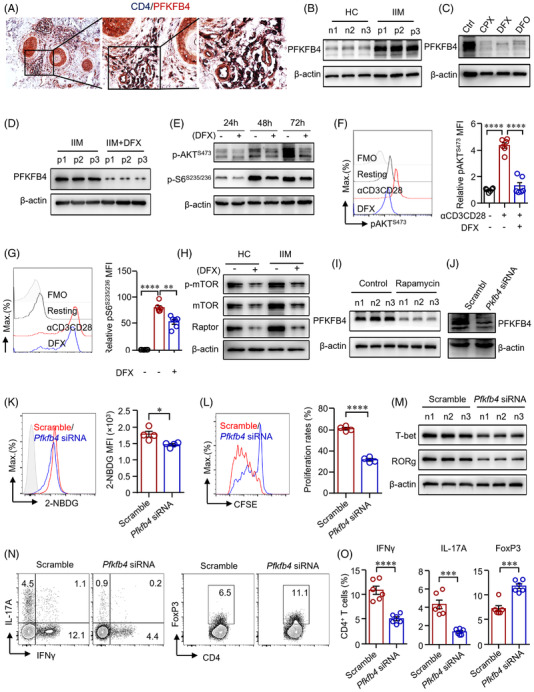
FIGURE 5.

Iron promotes glucose metabolism in CD4+ T‐cells through PFKFB4 in idiopathic inflammatory myopathies (IIM). (A) Double staining of CD4 (dark blue) and PFKFB4 (red) of skin sections from patients with IIM by immunohistochemistry. Original magnification: 200×. (B)–(I) CD4+ T‐cells were stimulated with anti‐CD3/CD28 beads for 72 h in the presence of ciclopirox (CPX) (1 μM), deferasirox (DFX) (2 μM), deferoxamine (DFO) (2 μM) or rapamycin (10 nM) as indicated. PFKFB4 expression in CD4+ T‐cells from IIM patients (p) or healthy controls (HC) (n) (B), or CD4+ T‐cells from HC treated with iron chelators (C), or CD4+ T‐cells from IIM treated with DFX (D) was measured by western blot. Representative bands of three independent samples. (E) Phosphorylation of AKT (p‐AKT) and p‐S6 (ribosomal protein) expression in CD4+ T‐cells from HC was measured by western blot. (F and G) CD4+ T‐cells from HC were stained with primary antibodies against p‐AKT and p‐S6, followed by Alexa Fluor 594‐conjugated goat anti‐rabbit IgG and measured by flow cytometry (n = 6). (H) Expression of phosphorylation of mTOR (p‐mTOR), mTOR and Raptor in CD4+ T‐cells from IIM or HC treated with or without DFX was measured by western blot. Representative bands of three independent samples. (I) PFKFB4 expression in CD4+ T‐cells from HC treated with rapamycin was measured by western blot (n = 3). (J)–(O) CD4+ T‐cells from HC or IIM were electrotransfected with Pfkfb4‐ or scramble siRNA. (J) Pfkfb4 knockdown efficiency was confirmed by western blot. (K) Uptake of 2‐NBDG by HC CD4+ T‐cells was measured by flow cytometry (n = 4). (L) CD4+ T‐cells from HC were labelled with carboxyfluorescein succinimidyl ester (CFSE) and cell proliferation was calculated for the dilution of CFSE as measured by flow cytometry (n = 4). (M) T‐bet and RORg expression in CD4+ T‐cells from HC was measured by western blot (n = 3). (N and O) Interferon gamma (IFNγ), interleukin (IL)‐17A and FoxP3 expression in CD4+ T‐cells from HC measured by flow cytometry. Data are mean ± SEM. **p < .01, ***p < .001 and ****p < .0001 by one‐way ANOVA followed by adjustments for multiple comparisons in panels (F and G) and Student's t‐test in panels (K), (L) and (O).
