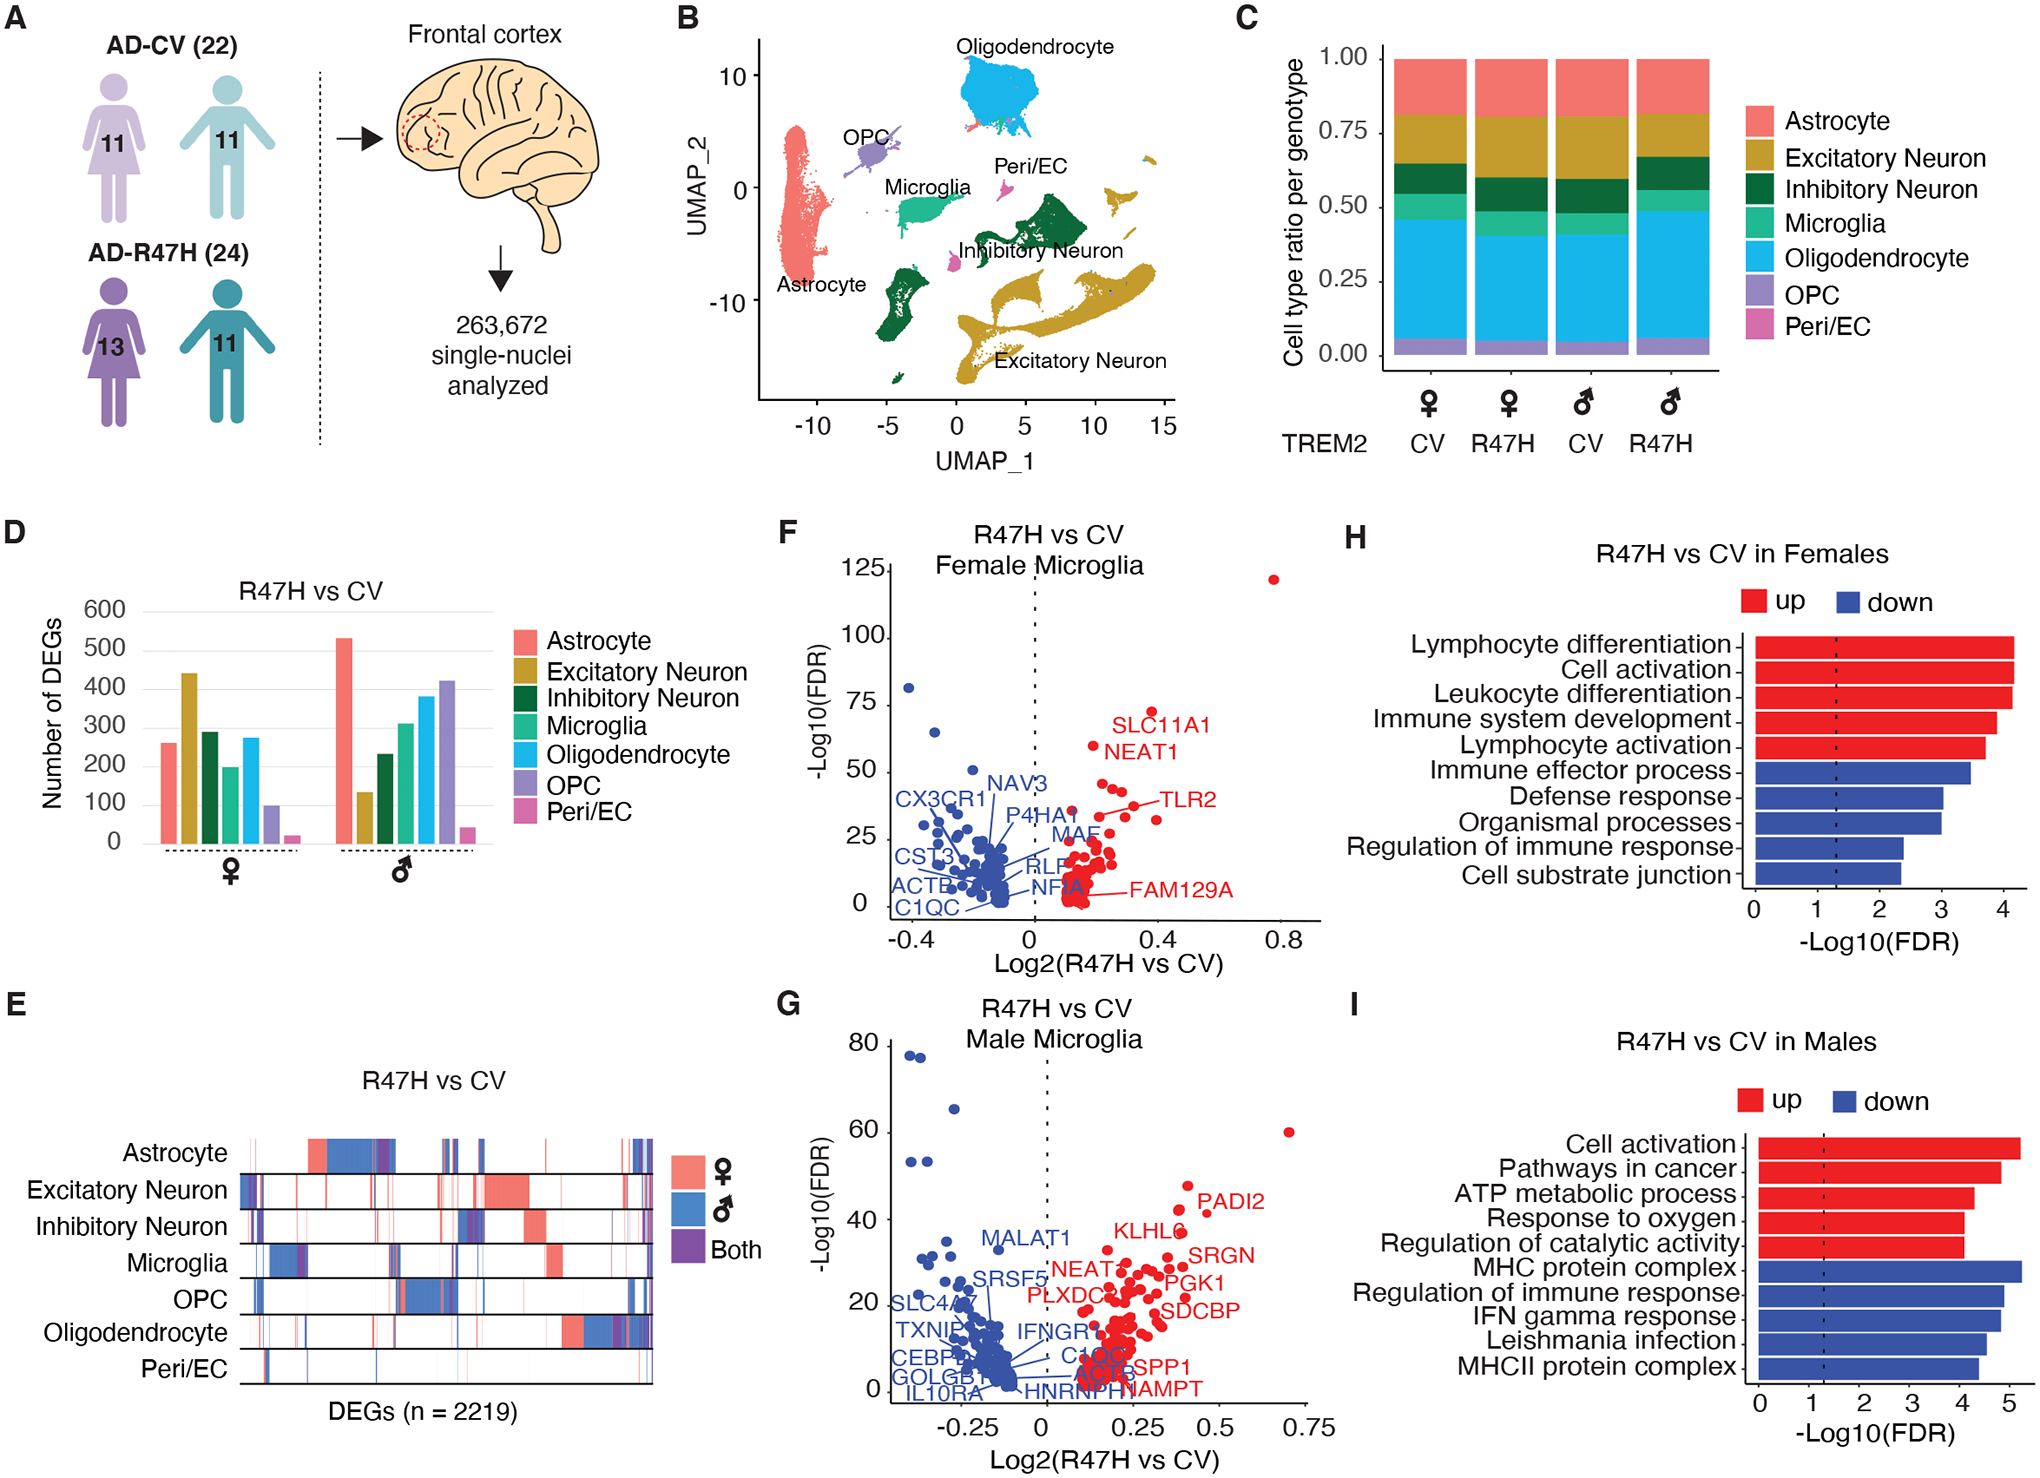
Fig. 1. R47H Mutation Induces Cell Type- and Sex-Specific Transcriptional Changes in Brains of Patients with AD.

(A) Schematic showing the sex and genotypes of age-matched human donors used for snRNA-seq. n = 263,672 nuclei were isolated from the mid-frontal cortex of patients with AD carrying the CV-TREM2 variant (n=22) and patients with AD carrying the R47H-TREM2 variant (n=24). Purple and turquoise cartoons denote females and males, respectively. See also table S1.
(B) UMAP plots of all single nuclei and their annotated cell types. Peri/EC = pericyte/endothelial cells, OPC = Oligodendrocyte precursor cells.
(C) Proportion of cell types for each of the 4 genotypes.
(D) Number of DEGs between R47H vs. CV samples for each cell type and each sex. FDR<0.05. See also table S3.
(E) Binary plot indicating whether a gene (column) is a DEG or not in a given cell type (rows) or in each sex (pink: female; blue: male; purple: overlapping in both sexes) (n=2,219 DEGs).
(F and G) Volcano plots of significant DEGs (FDR < 0.05) between R47H-TREM2 and CV-TREM2 samples in females (F) and males (G). Genes overlapping with DAM signatures highlighted (14). See also table S3.
(H and I) Bar plots of Gene Ontology pathways enriched in DEGs identified in F and G for female (H) and male (I) samples. Dashed line indicates the threshold of significant enrichment for the pathway analysis (-Log10(FDR) ≥ 1.3).
