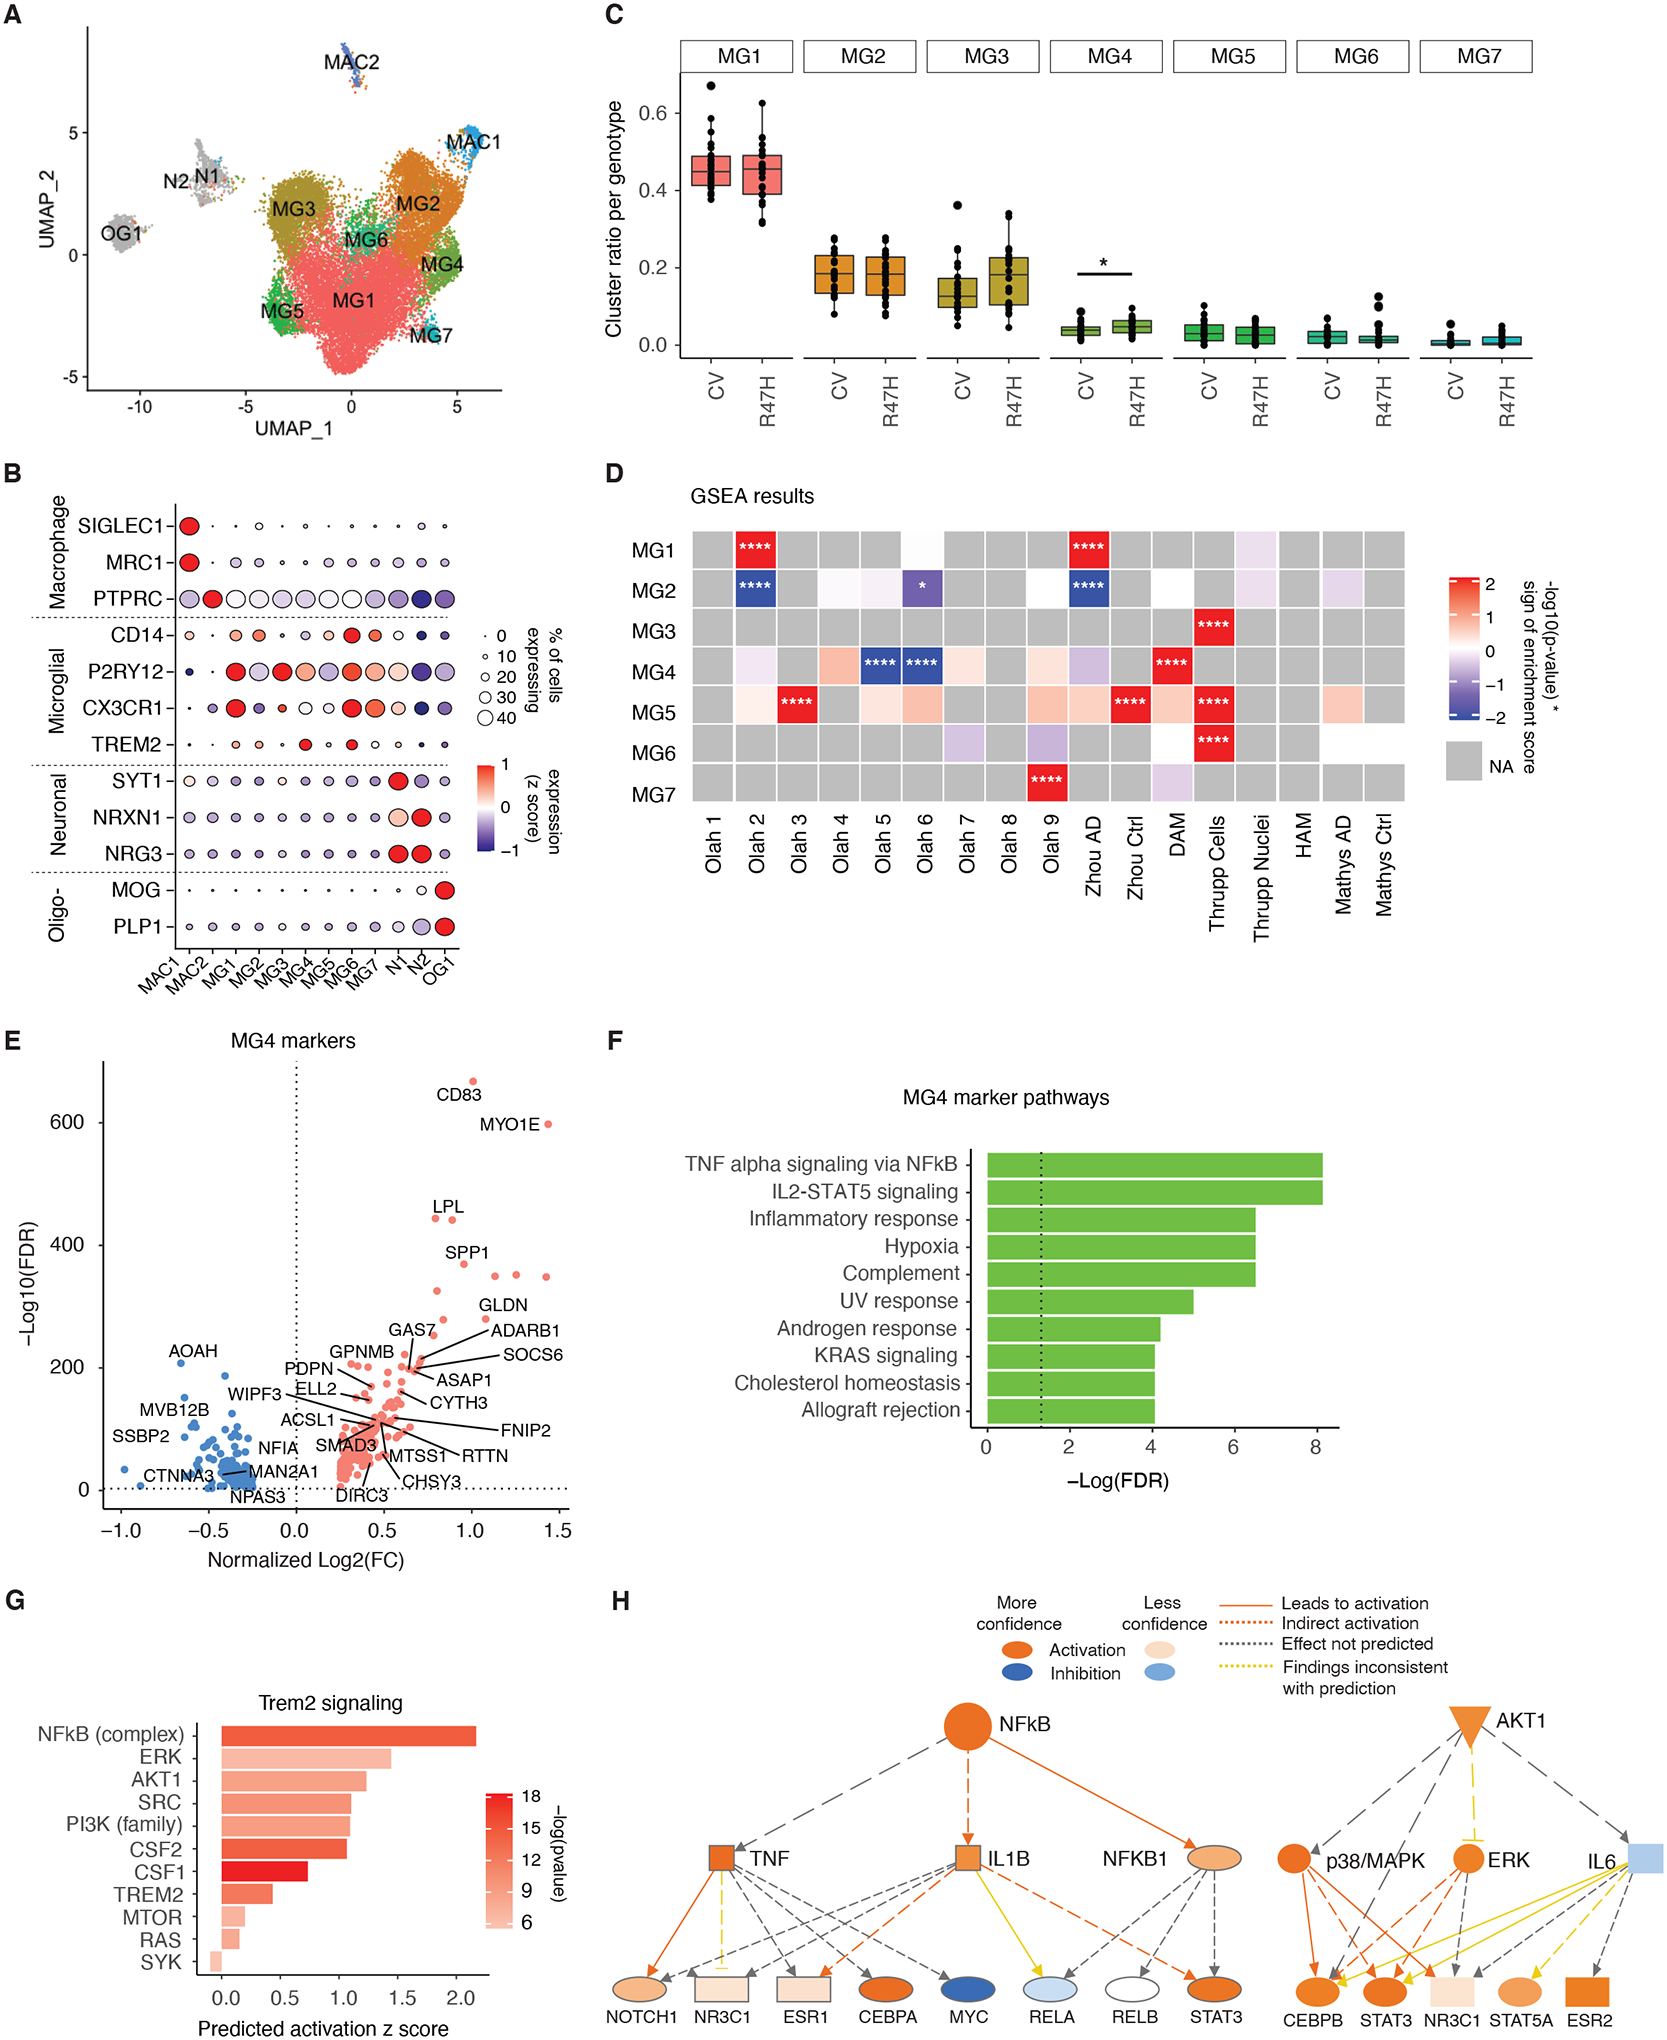
Figure 2. R47H Mutation Increases TREM2-Signaling in a Unique Microglia Cluster in Brains of Patients with AD.

(A) UMAP of microglia subclusters for all nuclei. MG = microglia, MAC = macrophage, N = neuron, OG = oligodendrocyte.
(B) Dot plot of selected marker genes expressed by each subcluster identified in (A).
(C) Boxplot of proportion of microglia subcluster per genotype. *p=0.048, negative binomial generalized linear model adjusted for brain bank location, sex, age, and APOE genotype.
(D) Heatmap of gene set enrichment analysis results (GSEA) for subcluster gene signatures. Colors denote positive enrichment (+1, red) or negative enrichment (−1, blue) multiplied by the −log10(p-value). Comparison datasets used are the following: Olah (32), Zhou (24), DAM (14), Thrupp (34), HAM (33), Mathys (21). *p<0.05, ****p<0.0001.
(E) Volcano plot of significant DEGs (FDR < 0.05) between MG4 and all other clusters. Genes overlapping with DAM signatures highlighted (14). See also table S4.
(F) Bar plot of GSEA Hallmark pathways based on the unique, non-overlapping markers for MG4 identified in (E). Dashed line indicates the threshold of significant enrichment for the pathway analysis (-Log10(FDR) ≥ 1.3).
(G) IPA of genes involved in TREM2 signaling based on MG4 gene signatures identified in (E).
(H) Diagram of the NF-κB and AKT activation network predicted by IPA upstream regulator analysis in (G).
