
Figure 4. R47H-hTREM2 Enhances the Disease-Associated Microglia Population and Elevates AKT Signaling.
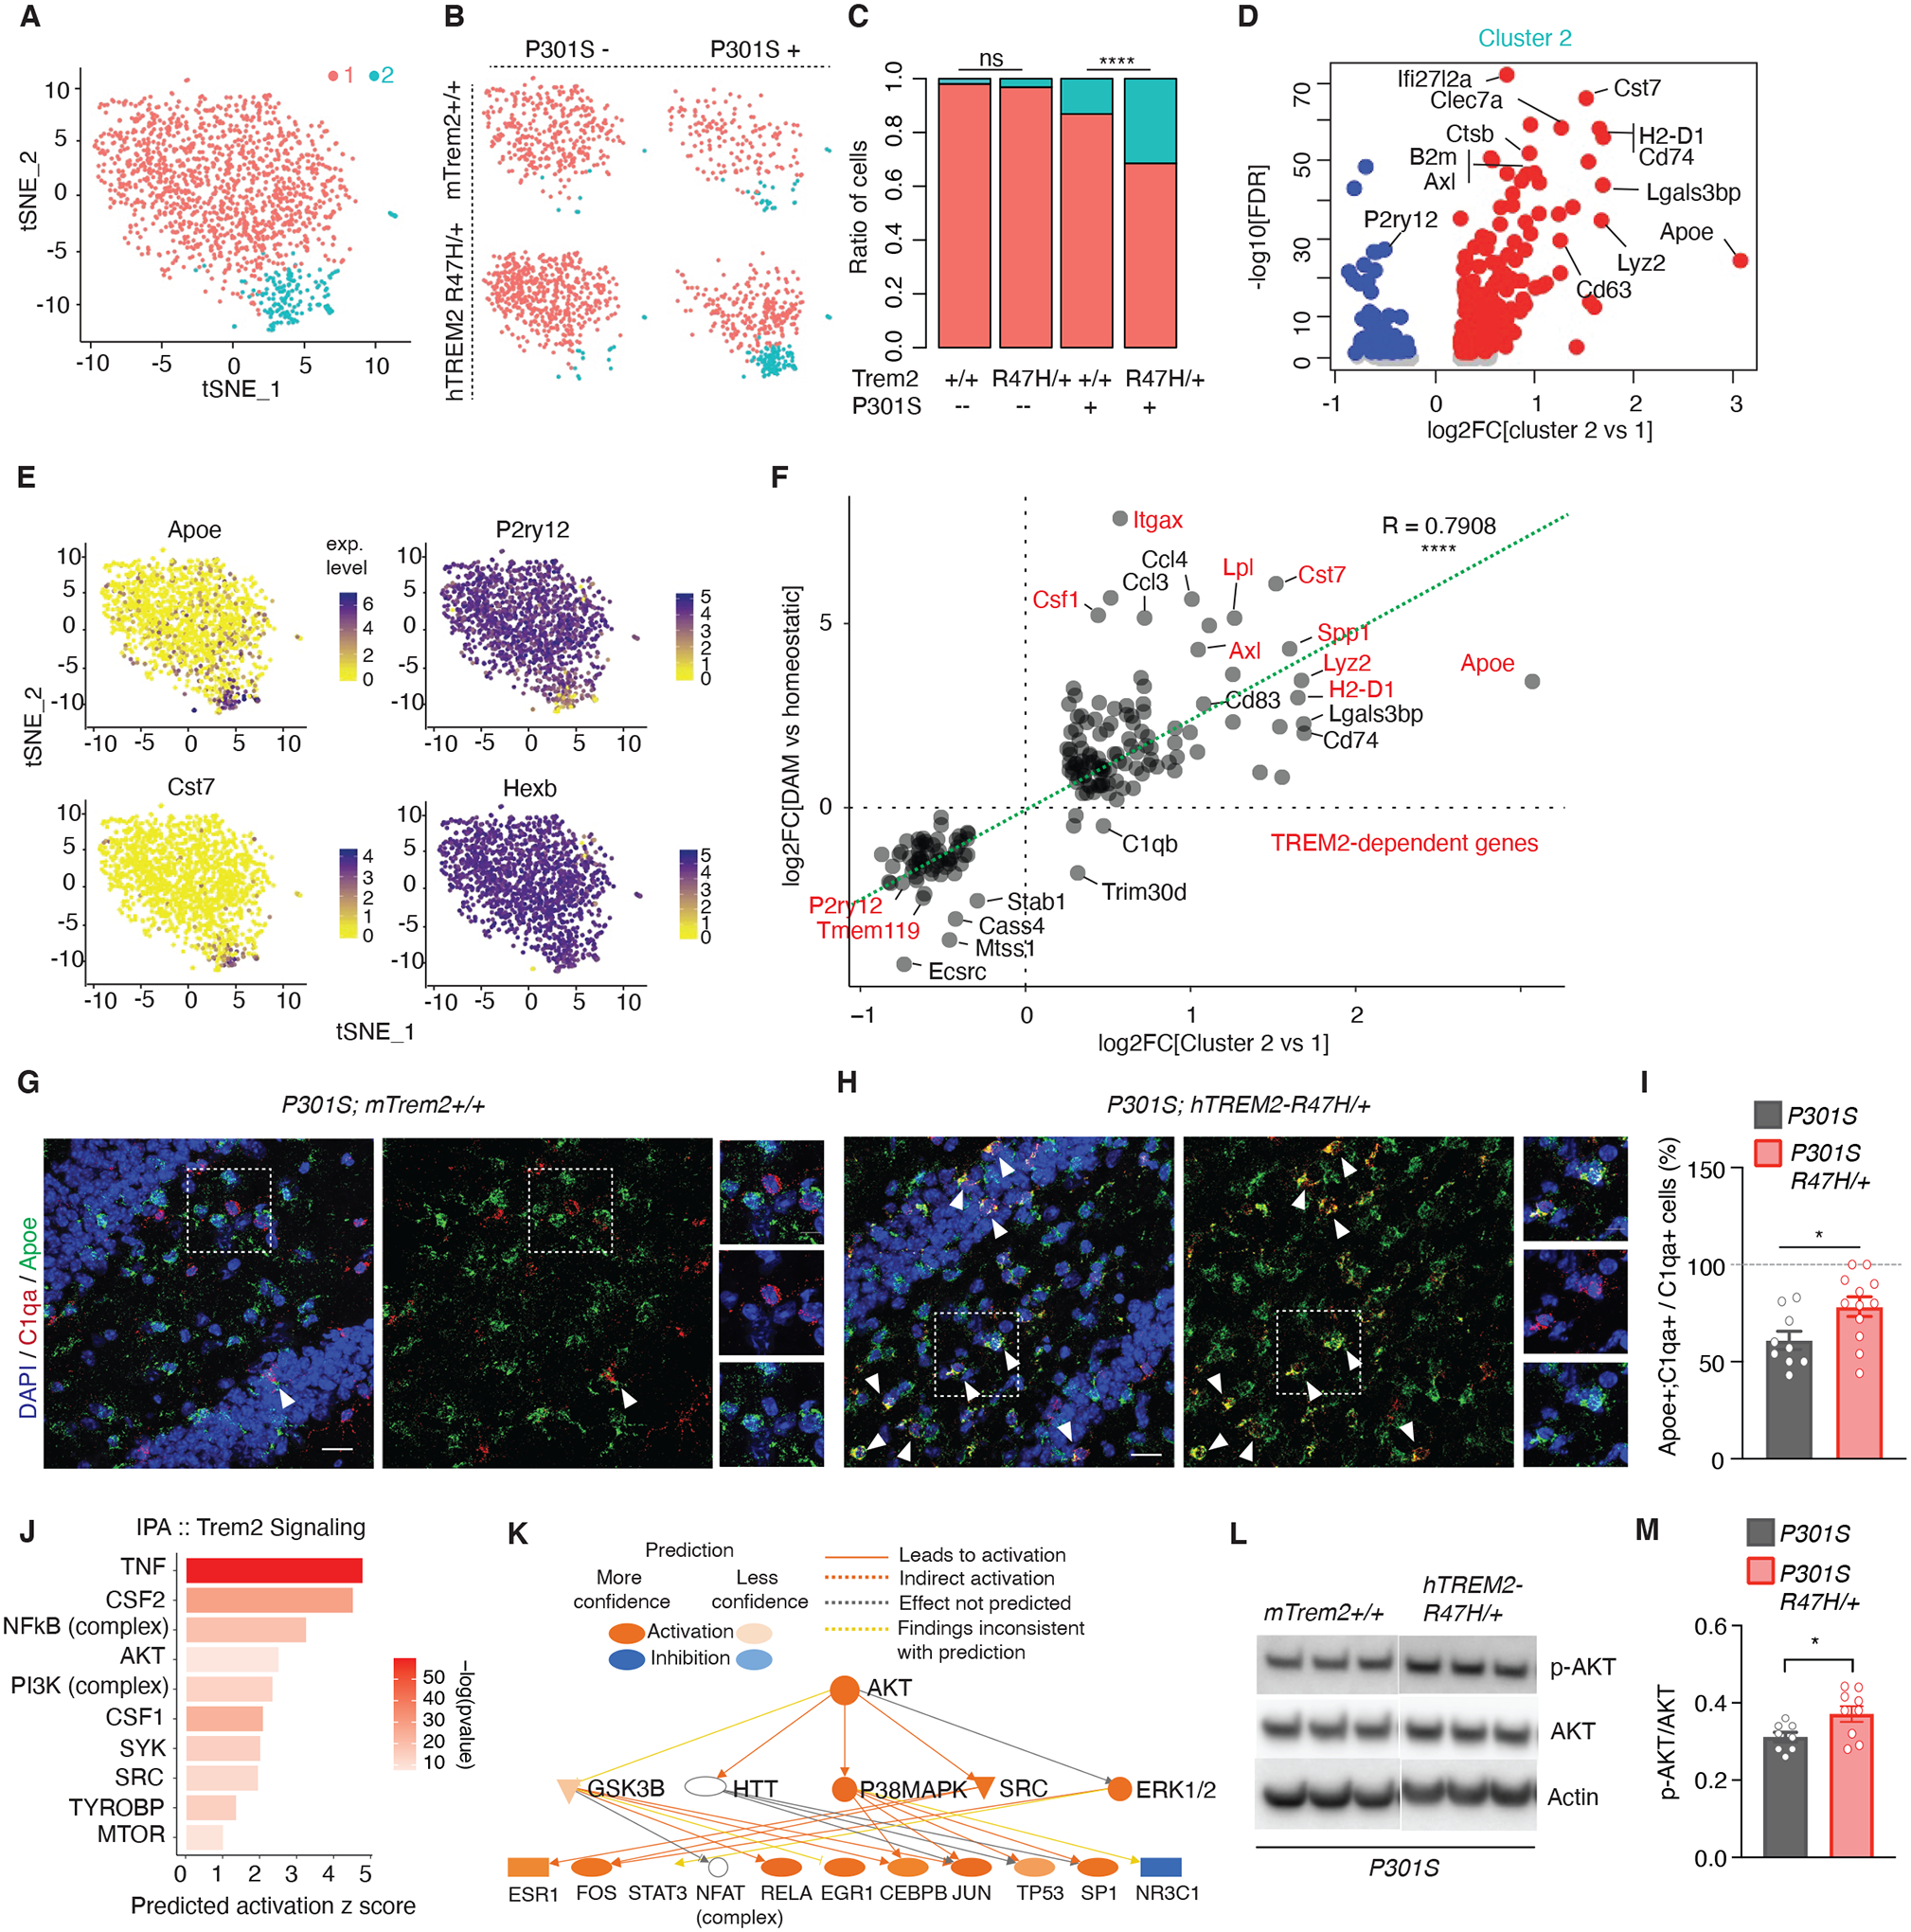
(A) t-SNE plot of all 1,424 microglial cells analyzed and clustered. (n = 3 mTrem2+/+, 2 hTREM2R47H/+, 1 P301S, 2 P301S hTREM2R47H/+, 8-month-old female mice).
(B) t-SNE plots based on clustering from (A) split by genotype.
(C) Ratio of cells in each cluster by genotype. ****p < 0.0001, two-sided Fisher’s exact test.
(D) Volcano plot of DEGs defining cluster 2 compared to cluster 1. See also table S7.
(E) Feature plots of transcript expression overlaid onto t-SNE of all microglial cells. Colored scale bar denotes normalized expression level.
(F) Correlation scatterplot of DEGs in the microglial cluster 2 vs cluster 1 comparison (x-axis) compared to disease-associated microglia (DAM/MGnD) versus homeostatic microglia (y-axis) previously published (14). Red genes are TREM2-dependent. r = 0.7908, ****p < 2.2e-16, Pearson’s correlation.
(G and H) Representative images of RNAscope using probes against C1qa (red) and Apoe (green) of P301S (G) and P301S hTREM2R47H/+ (H) dentate gyrus sections. White triangles highlight C1qa+;Apoe+ microglial cells. Dashed regions are zoomed in on the right side of the image. Scale bar = 20 μm, 10 μm for zoomed images.
(I) Quantification of RNAscope images for percent of cells that are C1qa+;Apoe+ over total C1qa+ cells. n = 9 sections, 3 mice for P301S; 12 sections, 4 mice for P301S hTREM2R47H/+. Student’s t-test, *p = 0.0254, t = 2.426, df = 19.
(J) IPA upstream regulator prediction for TREM2-signaling molecules based on cluster 2 markers from (D). Bar color denotes −log10(pvalue).
(K) IPA AKT activated network determined in (J) and its downstream predicted targets.
(L) Representative western blot of RIPA-soluble cortical lysates from 7- to 8-month-old mice immunoblotted for phospho-AKT, AKT, and β-actin. Lane 1–3= P301S mTrem2+/+, Lanes 4–6= P301S hTREM2R47H/+.
(M) Quantification of phospho-AKT levels normalized by total AKT levels of the entire cohort by western blot (n = 8 P301S mice, n = 9 P301S/R47H/+ mice). Student’s two-tailed t-test, * P < 0.05.
Values are mean ± SEM. Each sequencing dataset represents one independent sequencing experiment. See also fig. S7, fig. S8, and table S7.