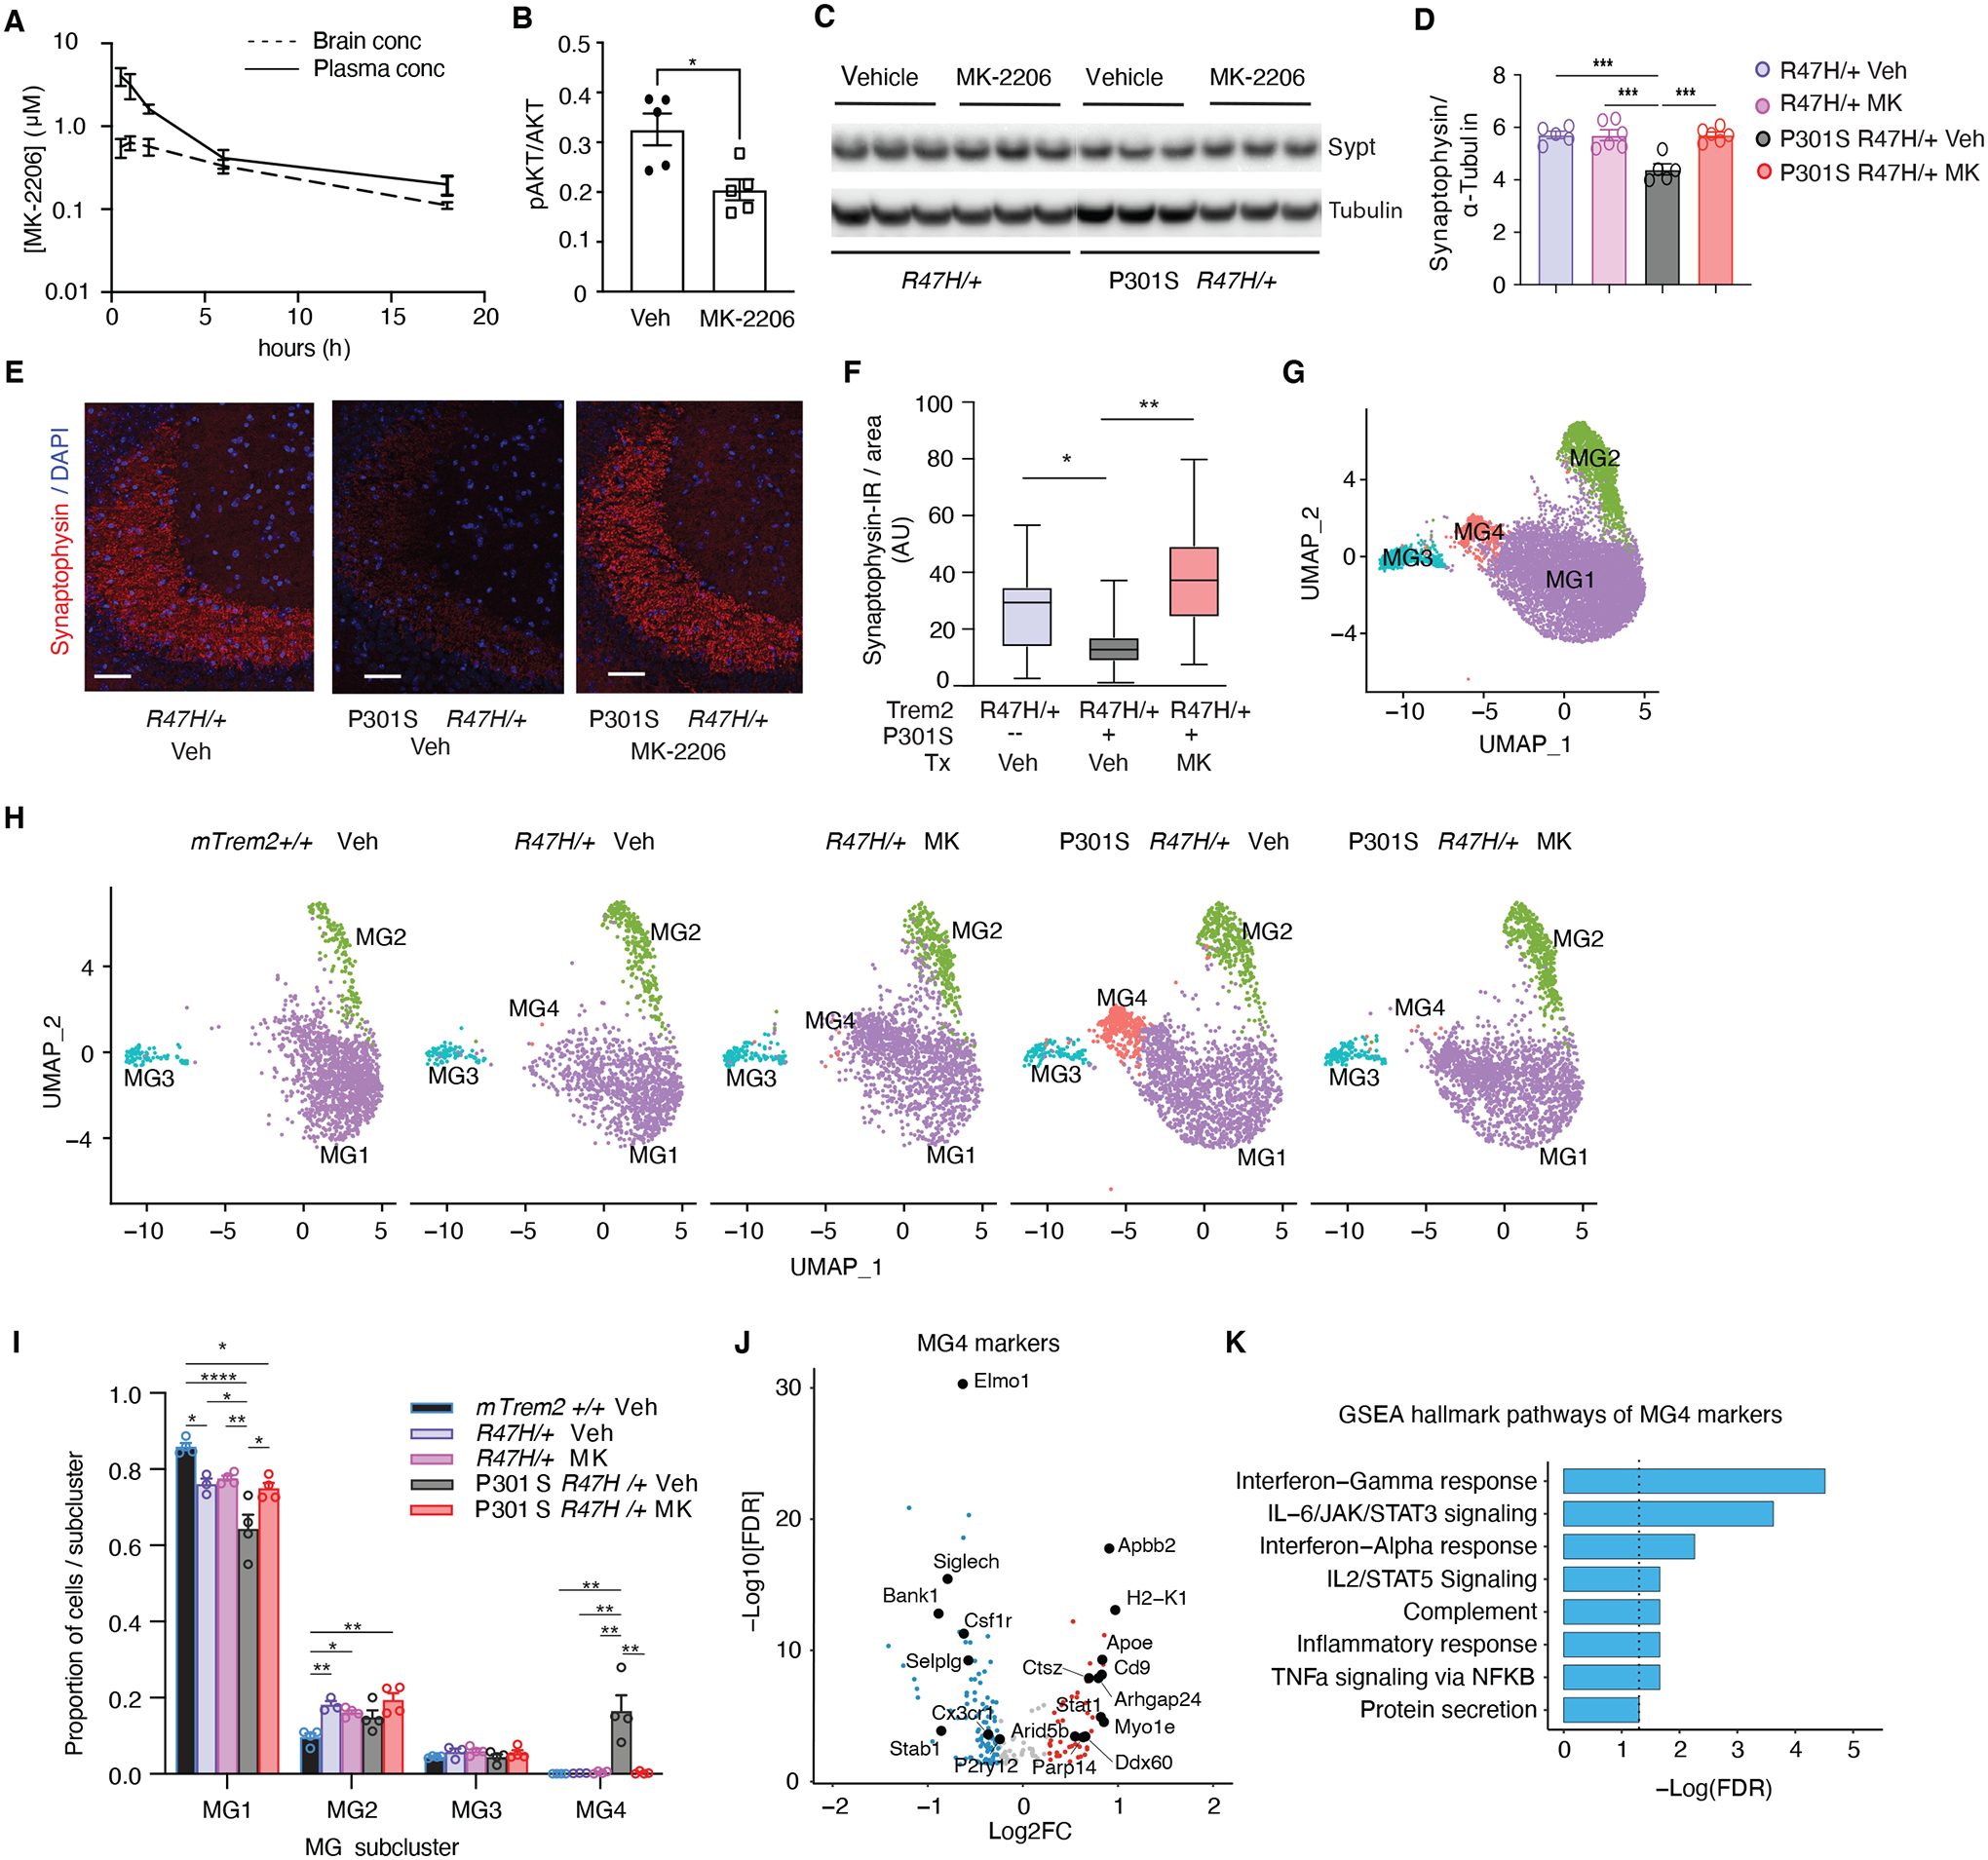
Figure 6. Pharmacological AKT-inhibition reverses Tauopathy-induced Pro-inflammatory Signature and Synapse Loss in R47H-hTREM2 Mice.

(A) MK-2206 concentrations in brain and plasma measured at different time points after oral gavage administration in mice. n = 3 per mouse per time point.
(B) Quantification of western blot showing protein levels of phospho-AKT normalized to total AKT in hippocampus of female hTREM2R47H/+ mice after 4 weeks of MK-2206 vs vehicle control (Veh) treatment. n = 5 mice/condition. *p < 0.05, unpaired student t-test.
(C) Representative western blot of RIPA-soluble cortical lysates from 7- to 8-month-old hTREM2R47H/+ and P301S hTREM2R47H/+ mice after 4-week MK-2206 vs vehicle treatment immunoblotted for synaptophysin (top bands) and α-tubulin (bottom bands). Lane 1–3 = hTREM2R47H/+ vehicle, Lanes 4–6 = hTREM2R47H/+ MK-2206, Lanes 7–9 = P301S hTREM2R47H/+ vehicle, Lanes 10–12 = P301S hTREM2R47H/+ MK-2206.
(D) Quantification of synaptophysin normalized by α-tubulin levels of the entire cohort by western blot. One-way ANOVA with Tukey’s multiple comparisons test. n = 5 mice/genotype/condition. ***p < 0.001.
(E) Representative images of synaptophysin immunostaining in CA3 hippocampal brain region of hTREM2R47H/+ mice treated with vehicle, P301S hTREM2R47H/+ mice treated with vehicle, and P301S hTREM2R47H/+ mice treated with MK-2206 for 9 weeks. Scale bar = 50 μm.
(F) Quantification of synaptophysin immunofluorescence in hTREM2R47H/+, P301S hTREM2R47H/+ treated with vehicle, and P301S hTREM2R47H/+ treated with MK-2206 (n = 5 per genotype). Pairwise linear mixed models. *p = 0.015, **p = 0.01.
(G) UMAP plots of 9,854 microglial single-nuclei analyzed and clustered.
(H) UMAP split by genotype and condition (Veh = vehicle, MK = MK-2206). (n = 4 mTrem2+/+, 3 hTREM2R47H/+ Veh, 4 hTREM2R47H/+ MK, 4 P301S hTREM2R47H/+ Veh, 4 P301S hTREM2R47H/+ MK, 8-month-old female mice).
(I) Ratio of cells in each cluster by genotype and condition. *p < 0.05, **p < 0.01, ****p < 0.0001, One-way ANOVA with Tukey’s multiple comparisons correction within each subcluster.
(J) Volcano plot of DEGs with FDR < 0.05 defining cluster MG4 compared to all other clusters.
(K) Bar plot of GSEA Hallmark pathways enriched in MG4 markers identified in (J). Dashed line indicates −Log10(FDR) ≥ 1.3.
