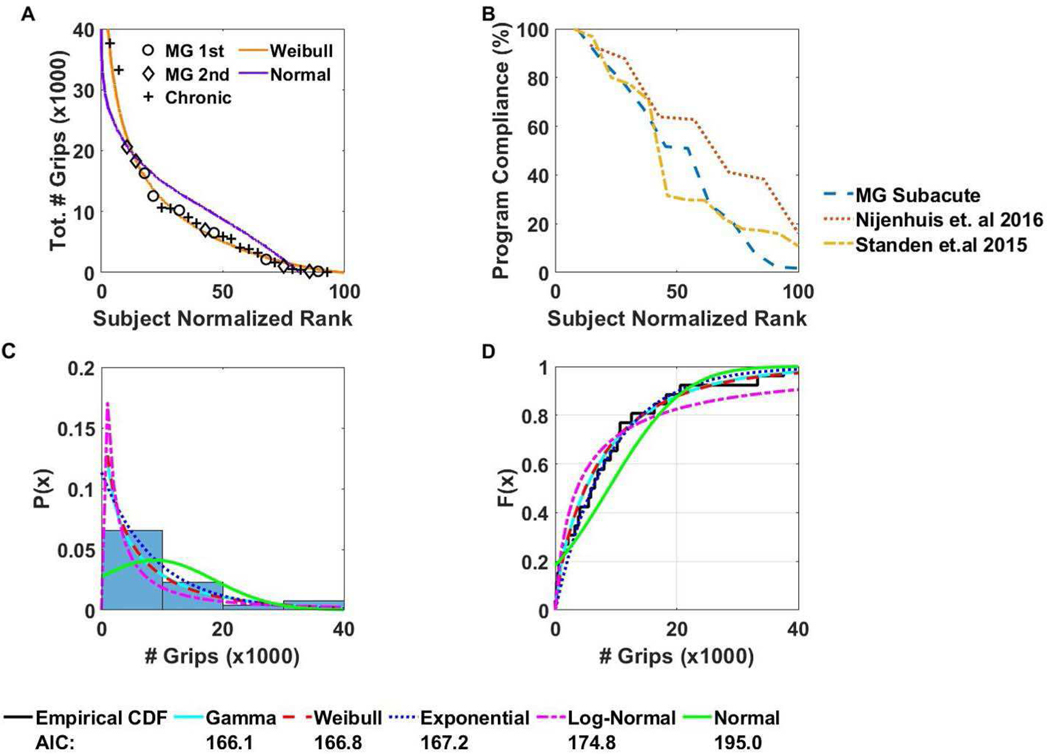
Fig. 4.
Analysis of underlying distribution of grip data, and user program compliance. A) The total number of grips completed versus the subject normalized rank (subject number / total number of subjects ∗100). Data from present and previous study with chronic users are combined. A Weibull distribution (shape parameter λ = 9400, scale parameter k = 0.96) fit the data well, better than a normal distribution B) Program compliance (# of hours device used / recommended hours of use) versus the subject normalized rank. Each line represents a different study which utilized a different home rehabilitation technology for the upper extremity C) Histogram of the total number of grips completed by all subjects against the probability distribution function estimate. Each distribution’s probability distribution is also plotted over the histogram. D) Empirical cumulative distribution function plotted against the theoretical cumulative distribution function of various distributions.

