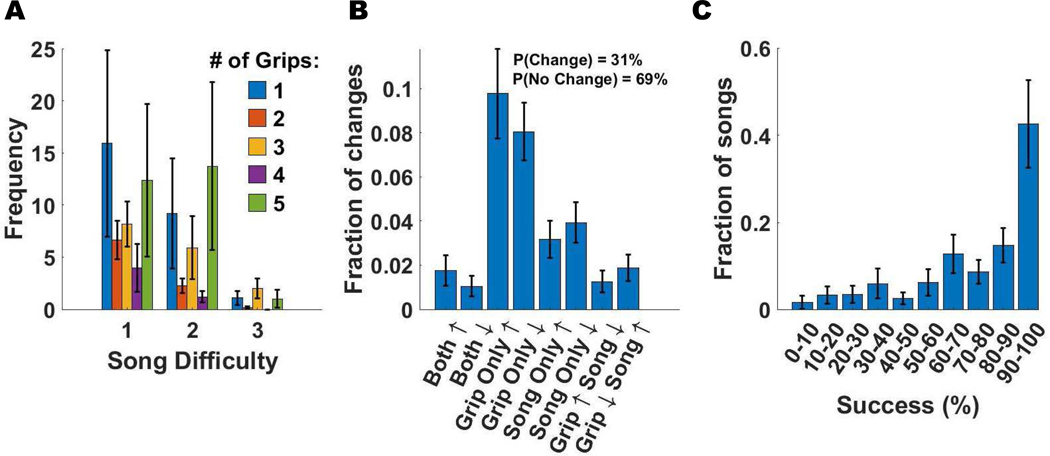
Fig. 5.
Analysis of adjustments made to game parameters across 1061 songs, as well as analysis of success levels. Each color on the plots A, B, D, E represents a different subject while each dot represents one song. A) Scatter plot of the song difficulty (1: easiest, 3: hardest) versus the number of grip types used B) Fraction of different types of parameter changes. The percent of games were a parameter was not changed was 69%. C) Fraction of songs played at different success levels.

