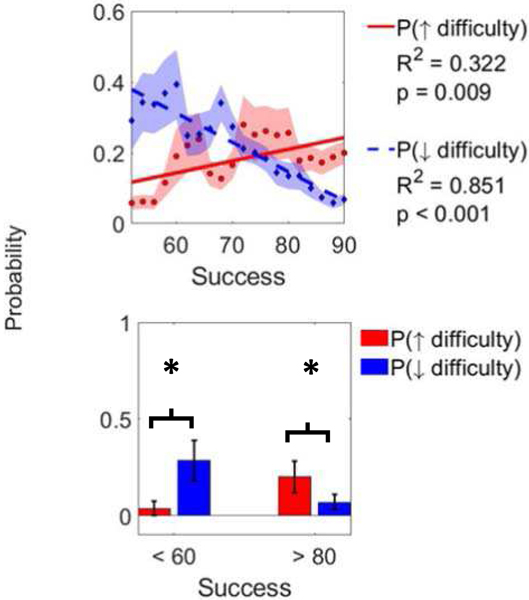
Fig. 6.
Top. Probability of increasing (solid line) or decreasing (dashed line) game difficulty (via song difficulty or number of grips) as a function of success on previous song. Each point is a probability calculated based on all songs played within 10 points of success level of that point. We required at least 100 songs to plot a point. Since subjects rarely played at low success levels, no points below 65% success were included. Bottom. Comparison of probabilities of increasing or decreasing game difficulty at low and high success. ∗ denotes p < 0.05.

