Figure 1.
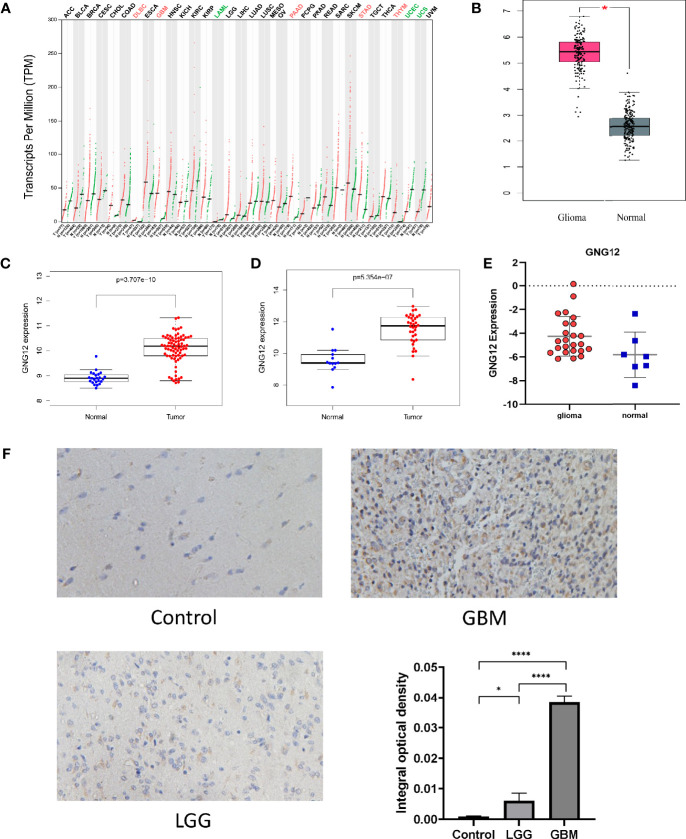
The expression of GNG12 at different levels (mRNA, protein, gene microarray and gene sequencing) in gliomas. (A) The expression of GNG12 in different types of tumor tissues in the GEPIA, the expression of GNG12 in glioma (n=163) and normal brain tissue (n=207), red and green respectively represent the difference in expression level. Green means that the gene is under-expressed in tumor tissues, and the red means the gene is highly expressed in tumor tissues. (B) In the GEPIA database, the expression of GNG12 is different in glioma and normal brain tissue. (C) Box plot based on the expression level of GNG12 in the GSE4290 (Glioma=77, Normal=23). (D) Box plot based on the expression level of GNG12 in the GSE50161(Glioma=34, Normal=13). (E) RT-qPCR experimental results show that the expression of GNG12 in gliomas is higher than that in normal tissues. (F) Results of immunohistochemical experiments in normal brain tissue, low-grade glioma and glioblastoma and statistical analysis (Magnification: *400). (****P<0.0001, *P<0.05) .

