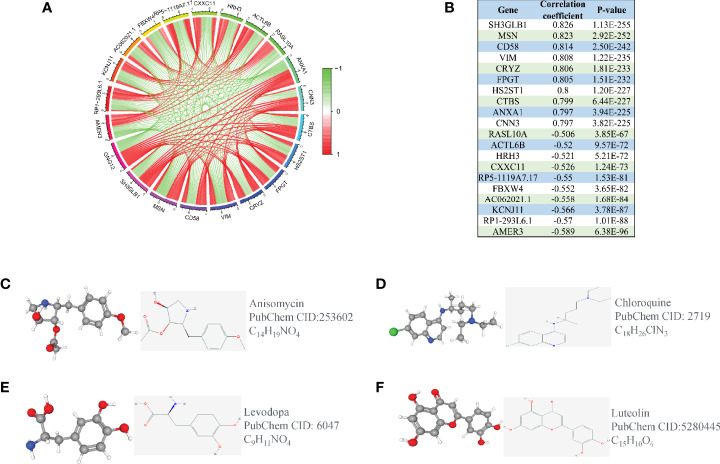
Figure 5.
Co-expression analysis of GNG12. (A) The ten most significant genes of positive and negative correlating with GNG12; (B) The correlation coefficients and P values of the ten most important positive and negative genes related to GNG12. Screening of gene therapy drugs for GNG12 in the CMap and PubChem database (Drug name, chemical structure, 2D structure, 3D structures). (C) Anisomycin (D) Chloroquine (E) Levodopa (F) Luteolin.

