Figure 6.

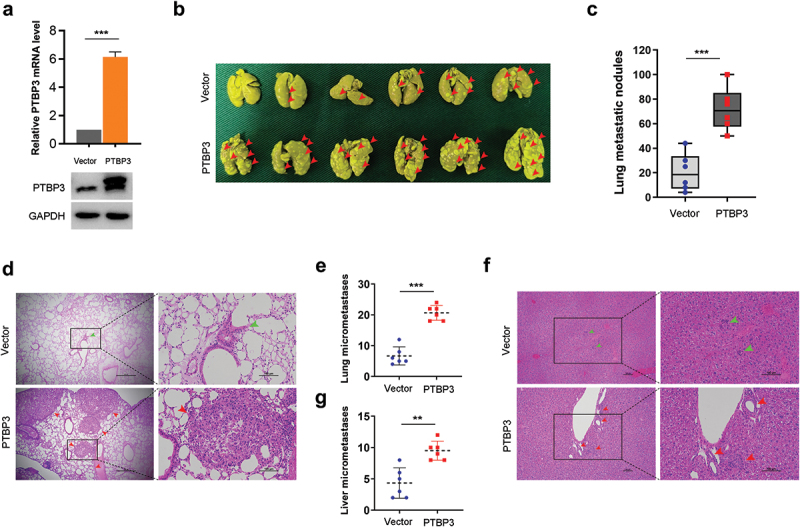
Overexpression of PTBP3 promotes TGF-β-driven LUAD cell metastasis in vivo. (a) qRT-PCR and Western-blot analysis of PTBP3 expression levels in A549 cells with stable PTBP3 overexpression. qRT-PCR data were presented as mean ± SD from three independent experiments. ***P < 0.001 by ANOVA. (b) The representative images of metastatic nodules formed in lungs removal from BALB/c nude mice at 8 weeks after intravenously injection of A549 control cells (Vector group) and PTBP3 stably overexpressed cells (PTBP3 group), with 6 mice per group in vector + TGF-β1 and PTBP3 + TGF-β1. Red arrowheads indicate lung metastatic nodules. (c) Lung metastatic nodules were counted and compared between vector group and PTBP3 overexpressed group. ***P < 0.001 by Student’s t-test. (d-g) The representative images of H&E staining for the evalution of lung (d) and liver (f) micrometastases. The arrowheads indicate metastatic nodules and micrometastases developed in lung and liver of vector group (green) and PTBP3 overexpressed group (red). Lung (e) and liver (g) micrometastases were counted and compared between vector group and PTBP3 overexpressed group. Scale bars are shown as indicated. **P < 0.01, ***P < 0.001 by Student’s t-test.
