Figure 1.

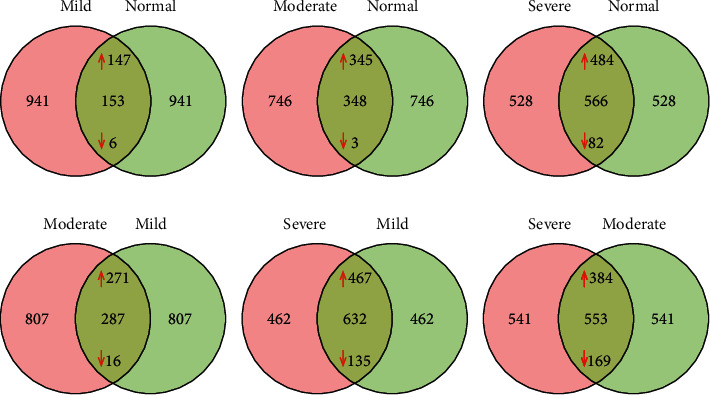
Venn diagrams to visualize the differentially expressed metabolites identified by different phenotype between the groups according to degree of renal function.

Venn diagrams to visualize the differentially expressed metabolites identified by different phenotype between the groups according to degree of renal function.