
Figure 4.
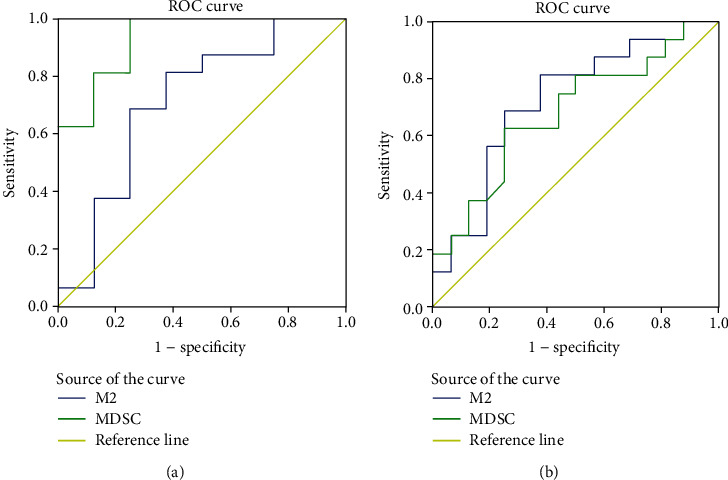
The ROC curve analysis about MDSCs and CD68+CD163+M2-like macrophages in NSCLC diagnosis and radiotherapy. (a) The ROC curve analysis in NSCLC diagnosis. (b) The ROC curve analysis in NSCLC radiotherapy.
Official websites use .gov
A
.gov website belongs to an official
government organization in the United States.
Secure .gov websites use HTTPS
A lock (
) or https:// means you've safely
connected to the .gov website. Share sensitive
information only on official, secure websites.
The ROC curve analysis about MDSCs and CD68+CD163+M2-like macrophages in NSCLC diagnosis and radiotherapy. (a) The ROC curve analysis in NSCLC diagnosis. (b) The ROC curve analysis in NSCLC radiotherapy.