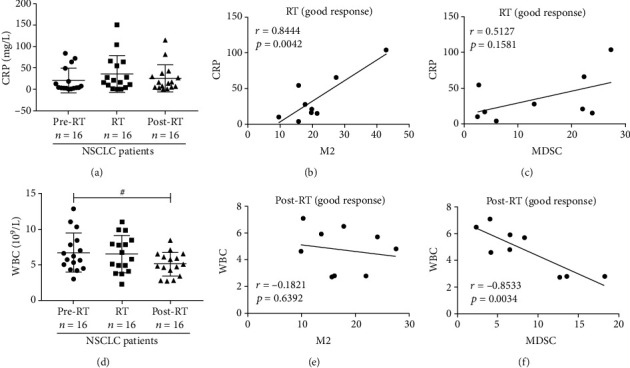
Figure 6.

The crossed correlation analysis of CRP and WBCs with MDSCs and CD68+CD163+ M2-like macrophages in NSCLC patients. (a) The bar graph of the expressions of CRPs in NSCLC patients of pre-RT, RT, and post-RT groups. (b, c) The correlation of CRPs of the good response group with CD68+CD163+ M2-like macrophages and MDSCs of NSCLC patients during radiotherapy. (d) The plot of the expressions of WBCs in NSCLC patients of pre-RT, RT, and post-RT groups. (e, f) The correlation of WBCs of the good response group with CD68+CD163+M2-like macrophages and MDSCs of NSCLC patients after radiotherapy. #p < 0.05. Data were analyzed by Pearson's correlation test.
