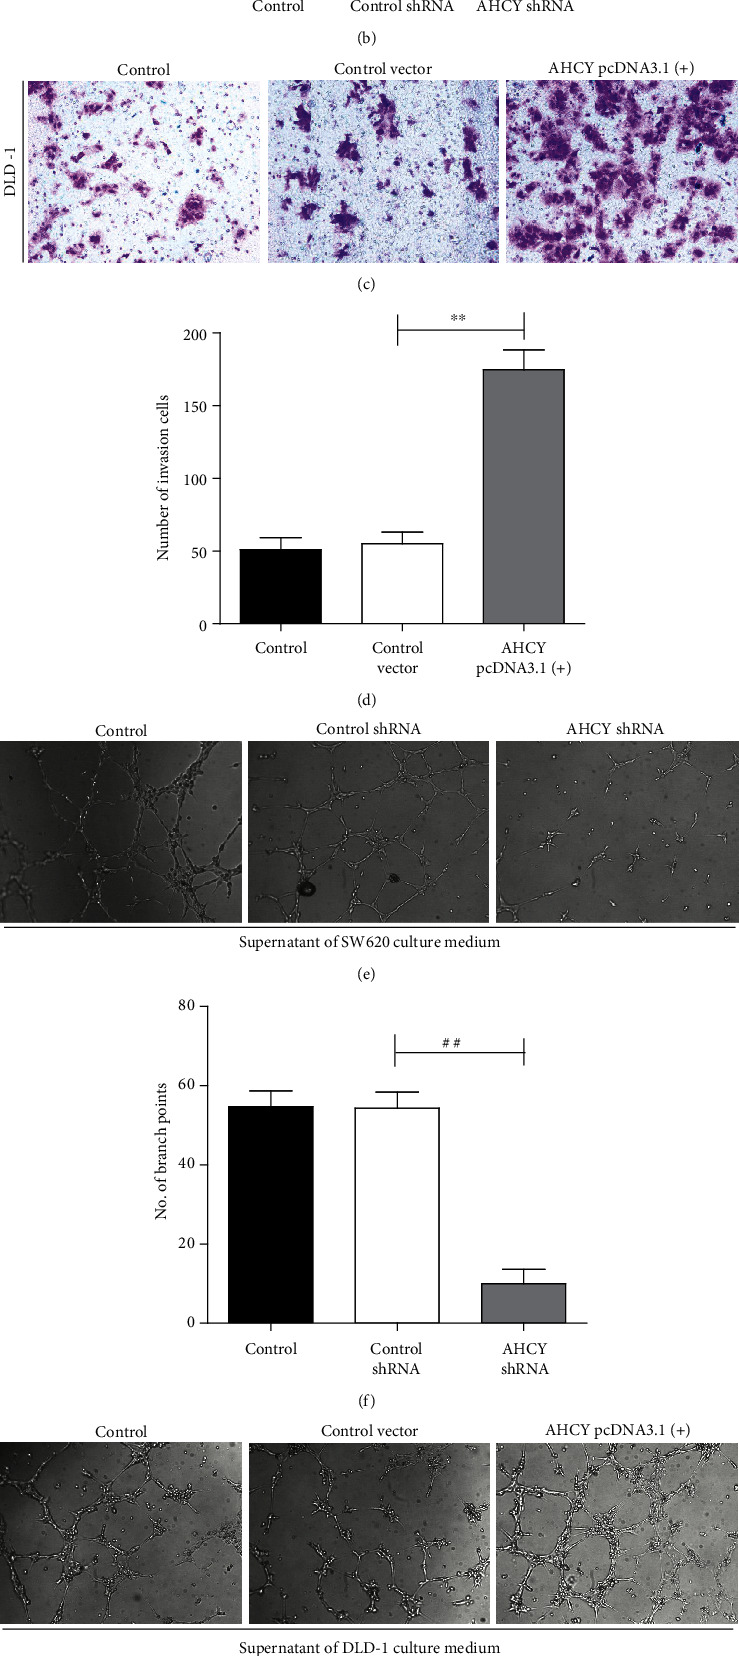
Figure 5.

AHCY overexpression induced cell invasion and tumor angiogenesis, whereas its knockdown weakened its function. (a) Effect of AHCY knockdown on tumor invasion of SW620 cells. (b) Quantitation of the number of invasion cells. (c) Effect of AHCY overexpression on tumor invasion of DLD-1 cells. (d) Quantitation of the number of invasion cells. (e) Effect of AHCY knockdown on tube formation of SW620 cells. (f) Quantitation of the number of branch points. (g) Effect of AHCY overexpression on tube formation of DLD-1 cells. (h) Quantitation of the number of branch points. Data are expressed as the mean ± SD (n = 3). ##p < 0.01 versus the control shRNA group; ∗∗p < 0.01 versus the control vector group.
