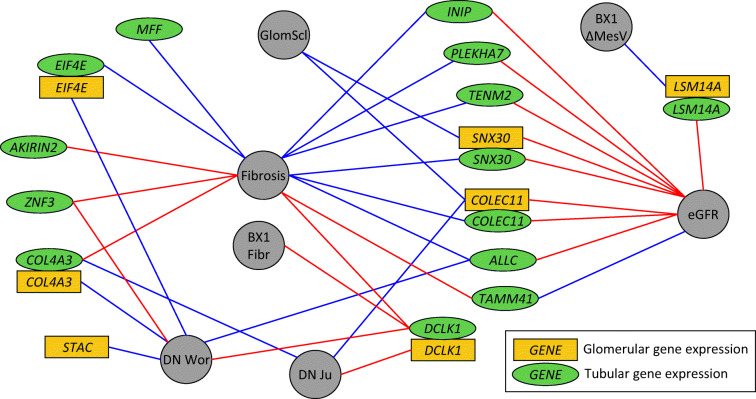
Fig. 4.
Tubular and glomerular gene expression of the lead genes correlates with multiple morphological and pathological renal variables and with DKD. Golden rectangles indicate glomerular gene expression, green ellipses tubular gene expression, and grey circles the morphological phenotypes. Blue lines indicate negative correlation and red lines indicate positive correlation. Correlation with fibrosis, glomerulosclerosis (GlomScl) and eGFR were measured in the nephrectomy samples [22]; correlations with p<2.2×10⁻⁴ (corrected for 29 genes, two tissues and four tests) are shown. For the biopsy data in Pima Indians, suggestive correlations with p<8.6×10⁻⁴ are shown (corrected only for 29 genes and two tissues), including fibrosis at first biopsy and change in the mesangial volume between the first and the second biopsies. Association with DKD (diabetic nephropathy) was queried in two data sets (Woroniecka et al [36] and Ju et al [35]), with p<4.3×10⁻⁴ or p<0.05 and fold change>1.5. BX1 Fibr, fibrosis at first biopsy; BX1 ΔMesV, change in the mesangial volume between the first and the second biopsies; DN Wor, diabetic nephropathy in Woroniecka et al [36]; DN Ju, diabetic nephropathy in Ju et al [35]; GlomScl, glomerulosclerosis

