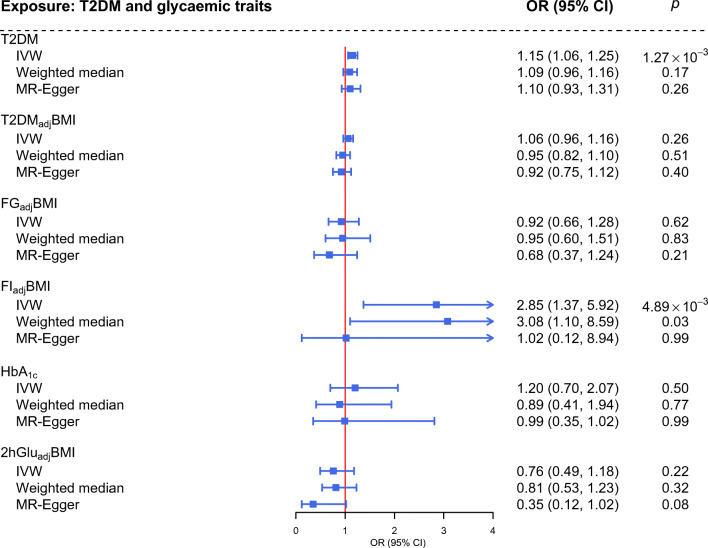
Fig. 2.
Estimates of the causal effects of genetically predicted type 2 diabetes and glycaemic traits on PCOS. The boxes denote the point estimates of the causal effects and the error bars denote the 95% CIs. The IVW approach was used in the primary analysis and the MR-Egger and weighted median approaches were used in sensitivity analyses. The ORs for PCOS were scaled to the per unit increase in log OR of type 2 diabetes and per unit increase in glycaemic traits. T2DM, type 2 diabetes mellitus

