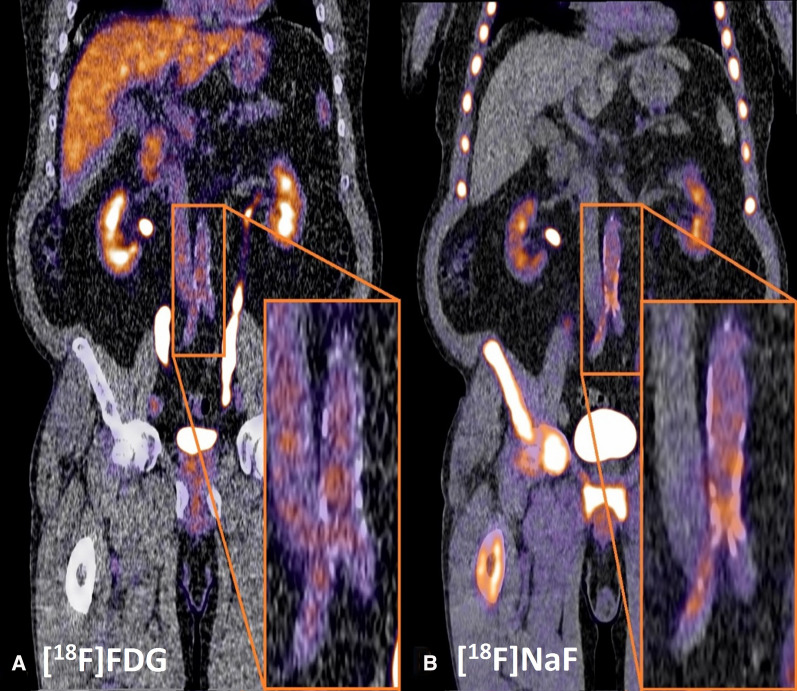
Figure 1.
[18Fluor]fluordeoxyglucose ([18F]FDG) and five-year follow-up [18Fluor]SodiumFluoride ([18F]NaF) positron emission tomography/low dose computed tomography in a patient with type 2 diabetes mellitus. A Metabolic active cells are visualized by [18F]FDG uptake can be found in the liver, heart, and more focal in arterial tissue (pop-up). In arterial tissue, [18F]FDG uptake is a marker for inflammation which is considered an important factor in the development of CVD. B [18F]NaF uptake demonstrates skeletal activity and, next to that, this tracer also visualizes micro-calcification formation in the arterial wall (pop-up). Both nuclear tracers are excreted via the kidneys, ureters, and bladder. For image processing and analysis Affinity 2.0 was used (Hermes Medical Solutions)

