Fig. 6.
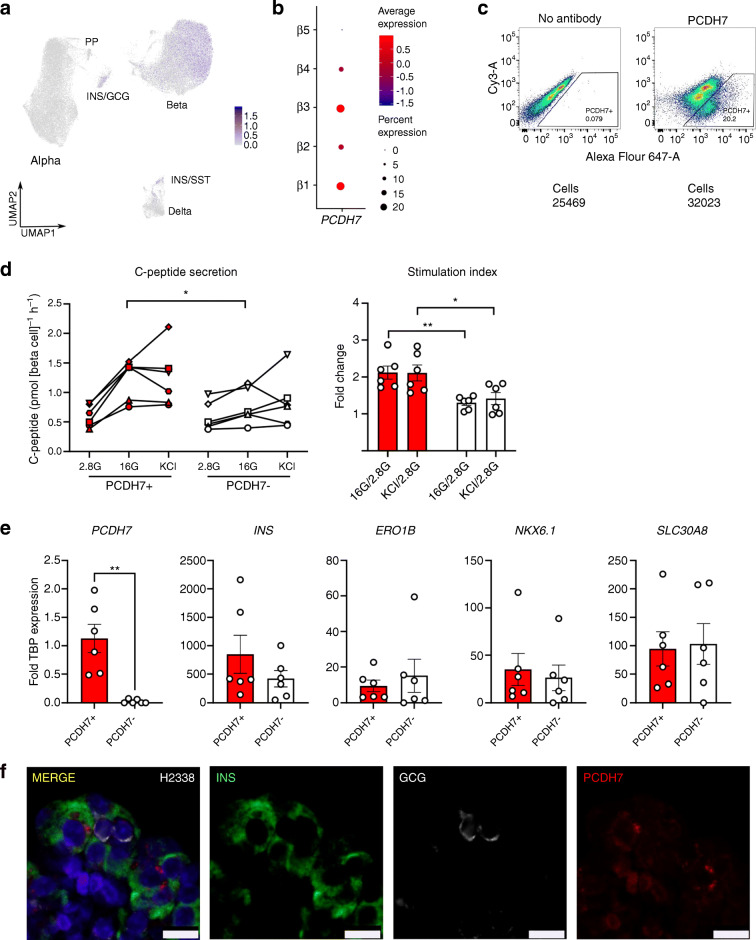
PCDH7 marks beta cells with enhanced GSIS. (a) UMAP plot of PCDH7 expression in endocrine cells. (b) Dot plot showing PCDH7 expression across beta cell clusters. (c) Sorting protocol used to isolate PCDH7+ beta cells from human islets. (d) C-peptide concentrations from a static GSIS performed on reaggregated PCDH7+ and PCDH7− beta cells from donors R366, R367, R369, H2330, H2337 and H2338, shown as separate symbols (see the Human Islets Checklist [ESM] for more details). Cells were exposed to 2.8 mmol/l glucose (2.8G), 16 mmol/l glucose (16G), and 40 mmol/l KCl (KCl). (e) qPCR for key beta cell maturity genes in PCDH7+ and PCDH7− sorted cells. (f) Immunostaining for INS (green), PCDH7 (red), GCG (white) and DAPI (blue) in a representative islet section of donor H2338. Scale bar, 10 μm *p<0.05 and **p<0.01. GCG, glucagon; INS, insulin; SST, somatostatin

