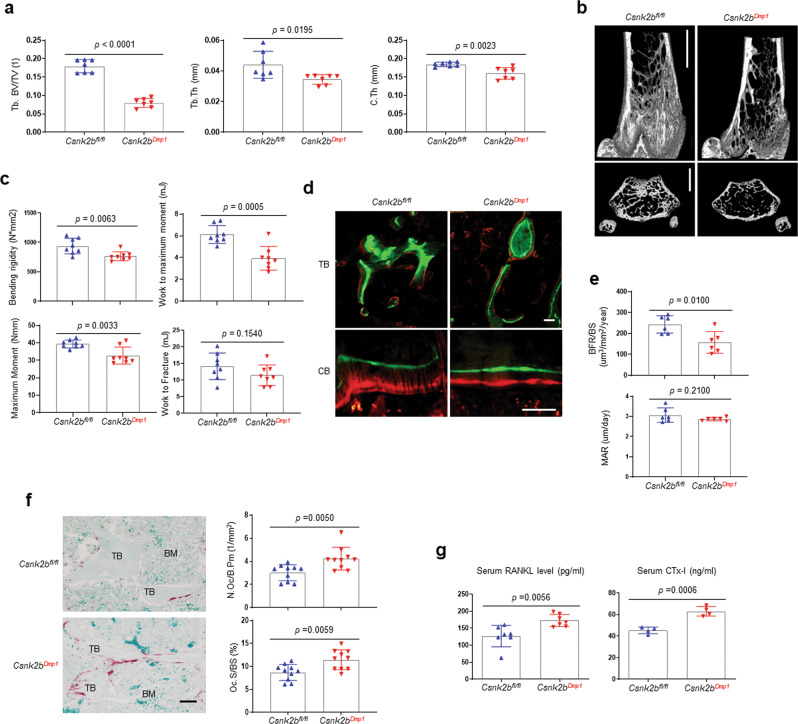
Fig. 2. Csnk2bDmp1 mice display severe osteopenia.
a, b MicroCT analysis showing a decrease of femoral bone mass in eight-week-old Csnk2bfl/fl and Csnk2bDmp1 male mice. Quantification (a) and 3D-reconstruction (b) are displayed. Trabecular bone volume/total volume (Tb. BV/TV), trabecular thickness (Tb.Th), and cortical thickness (C.Th) were measured. Scale bar, 1 mm (b). c Biomechanical properties of 8-week-old Csnk2bfl/fl and Csnk2bDmp1 femurs, including bending rigidity, maximum moment, work to maximum moment, and work to fracture were quantified using three-point bending test. d, e Dynamic histomorphometric analysis of eight-week-old Csnk2bfl/fl and Csnk2bDmp1 femurs. Representative images of calcein/alizarin red labeling of trabecular (d, top) and cortical bone (d, bottom) and relative histomorphometric quantification of BFR/BS and MAR (e). Scale bar, 50 μm (d). TB trabecular bone, CB cortical bone, BFR/BS bone formation rate per bone surface, MAR mineral apposition rate. f TRAP-stained longitudinal sections of eight-week-old Csnk2bfl/fl and Csnk2bDmp1 femurs. Representative images (left) and relative quantification (right) are shown. Scale bar, 50 μm (g, left). BM bone marrow, TB trabecular bone, N.Oc/B.pm osteoclast number per bone perimeter, Oc.S/BS osteoclast surface per bone surface. g Serum levels of receptor activator of nuclear factor kappa-Β ligand (RANKL) and cross-linked C-telopeptide of type 1 collagen (CTx-I) in eight-week-old Csnk2bfl/fl and Csnk2bDmp1 male mice were measured by ELISA. Data are representative of three independent experiments (b, d, f [left]) or are pooled from two experiments (a, c, e, f [right], g). A two-tailed unpaired Student’s t-test for comparing two groups (a, c, e–g; error bars, SD of biological replicates).

