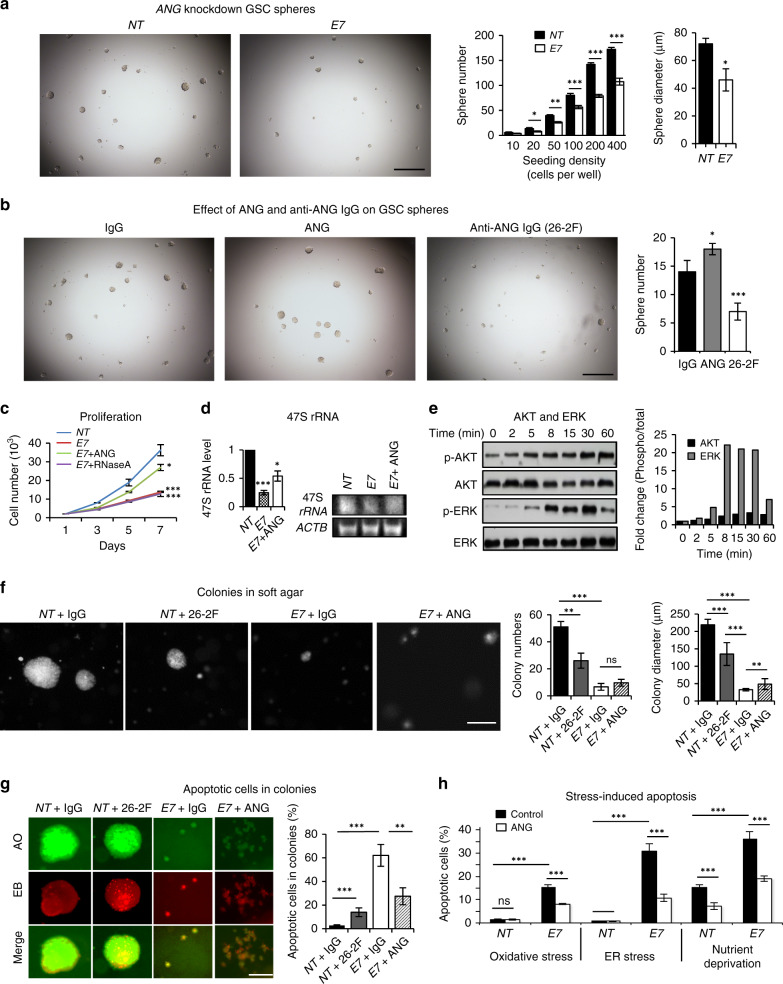
Fig. 2. ANG regulates self-renewal of GSCs and proliferation of GBM cells.
a GSC spheres of GS6-22 cells infected with non-targeting (NT) control and E7 ANG-specific shRNA. Cells were seeded at various density in 96-well plates and cultured in sphere medium for 7 days. The numbers of spheres with a diameter >30 µm were counted from the entire well. Sphere diameters shown were from the wells seeded with 200 cells. Bar = 500 μm. b GS6-22 spheres in the presence of a non-immune control IgG (30 μg/ml), ANG protein (1 μg/ml) and anti-ANG IgG 26-2 F (30 µg/ml) for 7 days. Spheres of >30 µm in diameter were counted from the entire well. Bar = 500 µm. c Proliferation of control or ANG knockdown U251 cells. ANG and RNaseA proteins were added at 1 μg/ml when cells were seeded. Cell numbers were determined by a Coulter counter. d 47 S rRNA in U251 cells determined by qRT-PCR using ACTB (β-actin) as the internal control. The product of a representative qRT-PCR reaction was analysed by agarose gel electrophoresis. e ERK and AKT phosphorylation in U251 cells induced by ANG (1 µg/ml). Band intensities of p-ERK and p-AKT were determined by Image J and normalised to the total ERK and AKT, respectively, of the corresponding time points. f Colony of control and ANG knockdown U87 cells formed in the presence of an isotype control IgG or 26-2 F (50 μg/ml), or in the presence of exogenous ANG (1 μg/ml). Colony numbers and diameters were counted and measured in 5 microscopic areas (×40). Bar = 500 μm. g Apoptotic cells in colonies of control (NT) or ANG knockdown (E7) U87 in the presence of isotype control IgG or 26-2 F (50 μg/ml), or in the presence of exogenous ANG (1 μg/ml). Live and apoptotic cells were stained green and red by AO and EB, respectively. The percentage of apoptotic cells was determined from 500 cells examined in each well. Bar = 200 μm. h Effect of ANG on stress-induced apoptosis of GBM cells. Control or ANG knockdown U87 cells were cultures in oxidative (SA, 0.25 mM), ER (tunicamycin, 12.5 µg/ml) and nutrient deprivation (serum-free) stresses in the absence or presence of ANG (1 µg/ml) for 5 days. Apoptotic cells were determined by AO/ER staining. The percentage of apoptotic cells was determined from 500 cells examined in each well. Data shown in the bar graphs are means ± SD of three replicates. *p < 0.05; **p < 0.01; ***p < 0.001, ns not significant.

