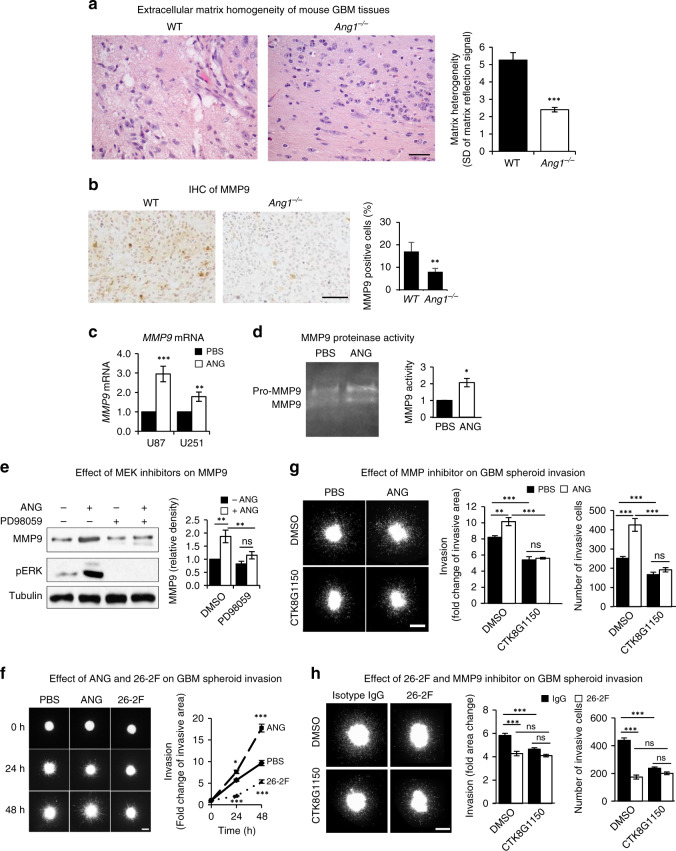
Fig. 3. ANG promotes GBM invasion through upregulation of MMP9.
a H&E staining of WT and Ang1−/− mouse GBM tissues. Bar = 50 μm. Pixels along 15 lines in 3 fields were determined and the standard deviation was used as indication of matrix heterogeneity. b IHC of MMP9 in WT and Ang1−/− mouse GBM tissues. MMP9 positive cells were counted among 500 total cells in each section. Bar = 50 μm. c qRT-PCR analysis of MMP9 mRNA normalised to GAPDH in U87 and U251 cells treated with or without exogenous ANG (1 μg/ml). d MMP9 zymography. The conditioned medium of U87 cells treated with or without ANG (1 μg/ml) was subjected to zymography. Image shown was from a representative experiment. e Effect of MEK inhibitor on ANG-induced MMP9 expression. U251 cells were cultured in the presence or absence of PD98059 (50 nM) and treated with or without ANG (1 μg/ml). Band intensity of MMP9 were determined by Image J and normalised to that of tubulin. f U251 spheroid invasion in response to ANG (1 µg/ml) or anti-ANG IgG 26-2 F (50 μg/ml). Tumour cells invaded into the matrix were recorded for 2 days. Invasive cells were defined as those that had migrated out of the initial spheroid area. The invasive area was defined by the area where invaded tumour cells were found. Data shown are fold changes of invasive area in comparison to the spheroid area at 0 h. Bar = 50 μm. g Effect of MMP9 inhibition on ANG-mediated invasion. U87 spheroids were treated with ANG (1 μg/ml), MMP9 inhibitor CTK8G1150 (50 nM) or both for 48 h. Bar = 200 μm. h Effect of MMP9 inhibition on ANG mAb-mediated inhibition of U87 spheroids invasion. Spheroids were treated with a non-immune isotype control IgG or ANG-specific IgG 26-2 F (50 μg/ml) in the presence or absence of MMP9 inhibitor CTK8G1150 (50 nM). Bar = 200 μm. Data shown in the bar graphs are means ± SD of three replicates. *p < 0.05; **p < 0.01; ***p < 0.001; ns not significant.

