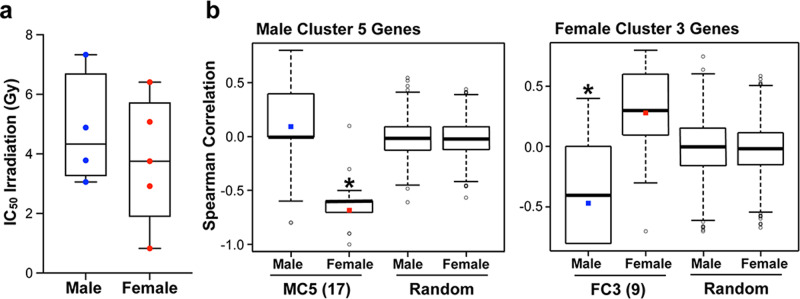
Fig. 1. Unique pathways contribute to cell-intrinsic radiation sensitivity in male and female human GBM lines.
a Box plots of irradiation IC50 values for four male and five female primary human GBM lines (horizontal bar indicates median). b Spearman correlation coefficients of irradiation IC50 values with expression of MC5 genes (17 genes), FC3 genes (9 genes), or random gene sets of the same size. For MC5 and FC3, box plots represent the distribution of the correlation coefficients for the 17 and 9 genes respectively. The colored square marks the average. For the random gene sets, the box plots represent the distribution of the Olkin-averaged Spearman correlation coefficient for 1000 gene sets of 17 (Male Cluster 5) or 9 (Female Cluster 3) randomly selected genes. MC5: male p = 0.245, female p < 0.001. FC3: male p = 0.025, Female p = 0.083.

