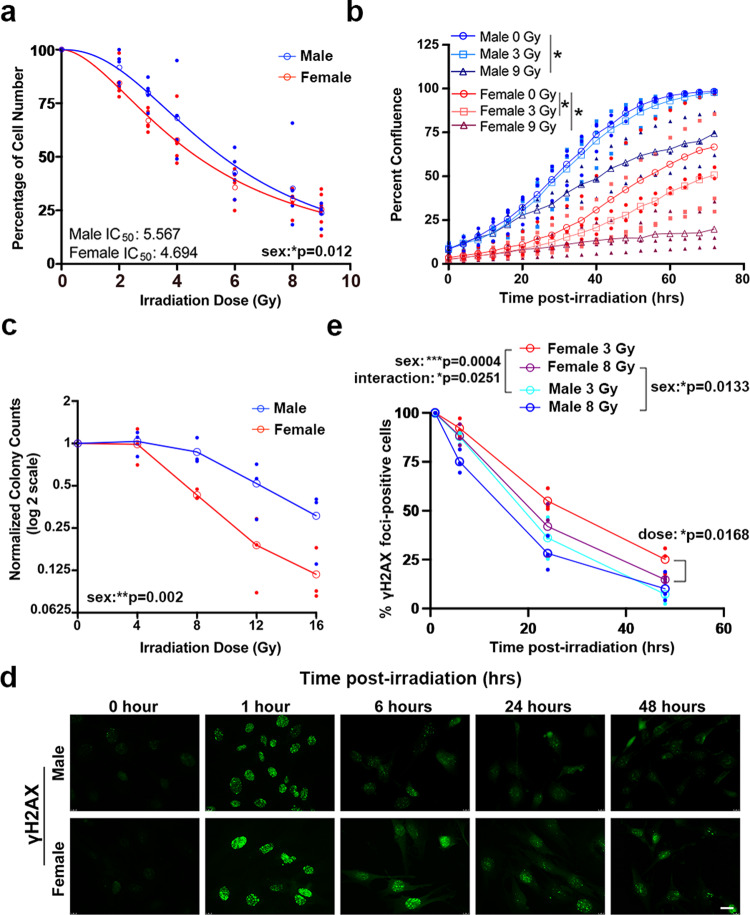
Fig. 2. Female mouse GBM model astrocytes are more sensitive to radiation treatment.
a Irradiation dose response curves in male and female Nf1−/− DNp53 astrocytes. Curves represent combined values from five separate established cell lines—each consisting of a corresponding male and female line generated at the same time. Male IC50 = 5.567 (95% CI 5.094–6.088), female IC50 = 4.694 (95% CI 4.349–5.061). Two-way ANOVA: dose p < 0.0001, sex p = 0.0123, interaction p = 0.6034. Open symbols are the means of the individual data points, which are presented as closed symbols. Lines are non-linear fits to the individual data points (n = 5/sex). b Male and female Nf1−/− DNp53 cell growth curves after irradiation with 0, 3, or 9 Gy. Cell growth was tracked using live cell imaging; images were taken every 4 h for 3 days and used to calculate percent confluence over time. Two-way repeated measures ANOVA—male 0 Gy vs male 3 Gy: time p < 0.0001, dose p = 0.3394, interaction p = 0.9087; male 0 Gy vs male 9 Gy: time p < 0.0001, dose p = 0.0325, interaction p < 0.0001; female 0 Gy vs female 3 Gy: time p < 0.0001, dose p = 0.0183, interaction p < 0.0001; female 0 Gy vs female 9 Gy: time p < 0.0001, dose p = 0.05, interaction p < 0.0001. Open symbols are the means of the individual data points, which are presented as closed symbols. Lines are non-linear fits to the individual data points (n = 3/sex). c Normalized colony counts from the clonogenic assay in male and female Nf1−/− DNp53 cells 5 days after irradiation with 0, 4, 8, 12, or 16 Gy. Two-way ANOVA: dose p < 0.0001, sex p = 0.002, interaction p = 0.111. Open symbols are the means of the individual data points, which are presented as closed symbols. (n = 3/sex). d Representative immunofluorescence images of male and female Nf1−/− DNp53 astrocytes stained for γH2AX 0, 1, 6, 24, and 48 h after irradiation with 3 Gy. Scale bar, 20 μm. e Quantification of the percent of cells with >10 γH2AX foci at each timepoint in male and female Nf1−/− DNp53 astrocytes following irradiation with 3 or 8 Gy. Two-way ANOVA—male 3 Gy vs female 3 Gy: time p < 0.0001, sex p = 0.0004, interaction p = 0.0251; male 8 Gy vs female 8 Gy: time p < 0.0001, sex p = 0.0133, interaction p = 0.2784; female 3 Gy vs female 8 Gy: time p < 0.0001, dose p = 0.0168, interaction p = 0.2959.

