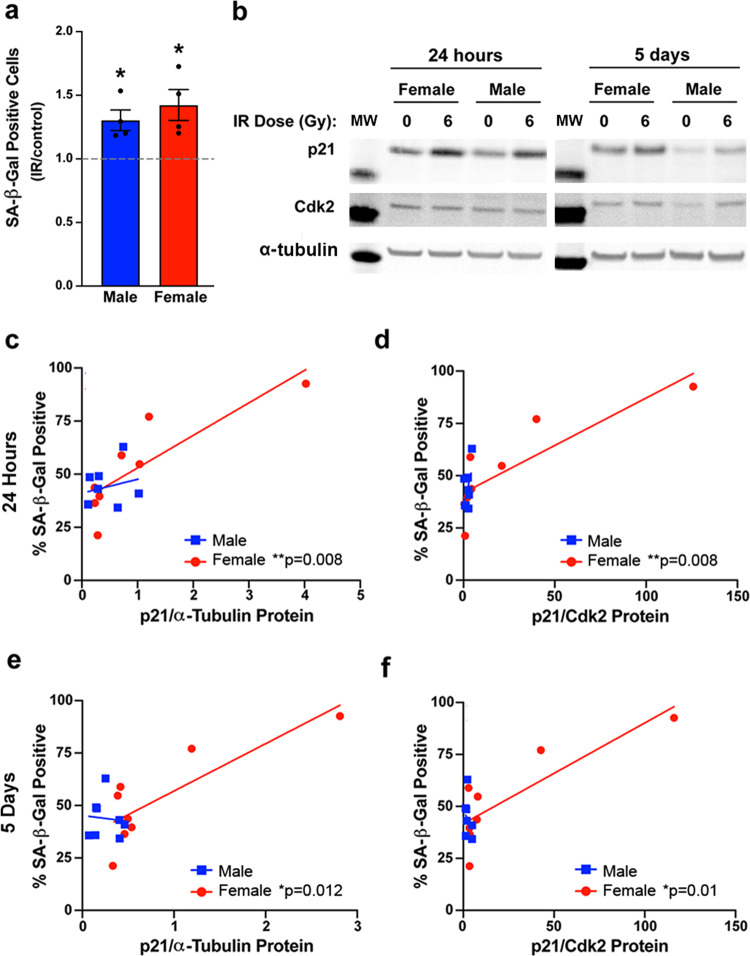
Fig. 6. Primary human GBM lines exhibit sex differences in the relationship between p21 and SA-β-gal positivity.
a Fold change (irradiated/control) in the percentage of SA-β-gal positive cells 5 days after irradiation with 0 or 6 Gy in four male and four female primary human GBM lines. *p = 0.0329 (male) and *p = 0.0401 (female). b Representative western blot images of p21 and Cdk2 24 h and 5 days after irradiation with 0 or 6 Gy in male and female human GBM lines. Molecular weight markers (MW): p21 (15 kDa), Cdk2 (30 kDa), α-Tubulin (50 kDa). c Correlation between p21 protein levels at 24 h after irradiation with 0 or 6 Gy and the percentage of SA-β-gal positive cells at 5 days after irradiation in male and female human GBM lines. Male correlation: r = 0.23, p = 0.5783, female correlation: r = 0.85, p = 0.008 (n = 8/sex). d Correlation between the p21/Cdk2 protein ratio at 24 h after irradiation with 0 or 6 Gy and the percentage of SA-β-gal positive cells at 5 days after irradiation in male and female human GBM lines. Male correlation: r = 0.54, p = 0.1649, female correlation: r = 0.85, p = 0.0081 (n = 8/sex). e Correlation between p21 protein levels at 5 days after irradiation with 0 or 6 Gy and the percentage of SA-β-gal positive cells at 5 days after irradiation in male and female human GBM lines. Male correlation: r = −0.09, p = 0.8408, female correlation: r = 0.83, p = 0.0115 (n = 8/sex). f Correlation between the p21/Cdk2 protein ratio at 5 days after irradiation with 0 or 6 Gy and the percentage of SA-β-gal positive cells at 5 days after irradiation in male and female human GBM lines. Male correlation r = −0.27, p = 0.5179, female correlation: r = 0.84, p = 0.0099 (n = 8/sex).

