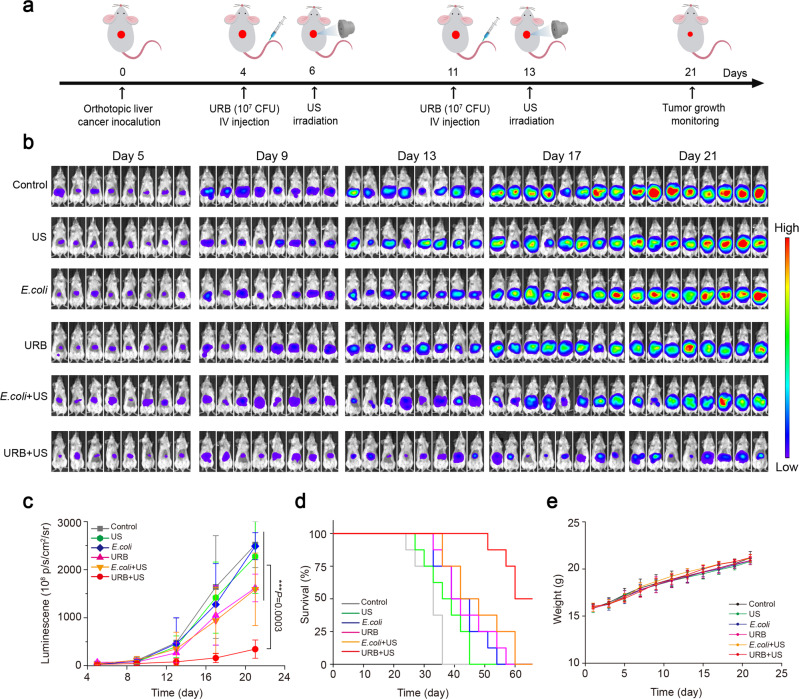
Fig. 7. Growth inhibition effect of orthotopically transplanted liver tumor.
a Schematic showing the treatment schedule in the orthotopically transplanted liver tumor model (n = 8). b Representative bioluminescence images of liver tumor-bearing mice in different groups. c Bioluminescence quantification of liver tumor-bearing mice treated with different treatments. n = 8 biologically independent animals per group (Asterisks: URB + US group vs every other group). d Survival curves of tumor-bearing mice for different treatment groups. e Weight change of mice treated with different treatments. Data were presented as mean ± S.D. Statistical analysis was calculated by using one-way analysis of variance with a Tukey’s test (****P < 0.0001; ***P < 0.001; **P < 0.01; *P < 0.05). Source data are provided as a Source Data file.

