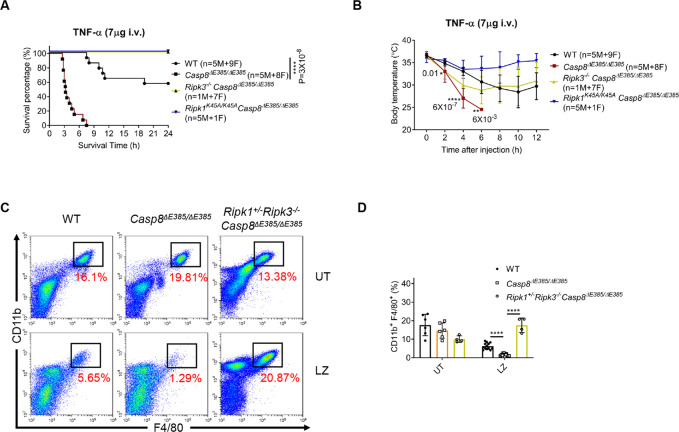
Fig. 4. The CASP8(ΔE385) promotes necroptosis in vivo.
A Mouse survival curve of 8- to 16-week old mice after injection by TNF-α (7 μg each mouse, i.v.). M, male, F, female. P values alongside the asterisk, by two-sided Log-rank (Mantel-Cox) test. ****p < 0.0001. B Body temperature of 8- to 16-week old mice after injection by TNF-α (7 μg each mouse, i.v.). M, male, F, female. Bars, mean ± SD. The significance of body temperature between WT and Casp8ΔE385/ΔE385 mice in the indicated time was described by P values below the asterisk (unpaired, two-tailed t test) *p < 0.05, **p < 0.01, ****p < 0.0001. C Representative peritoneal macrophages flow cytometric dot plots along CD11b versus F4/80 parameters. Untreated (UT), LPS + zVAD (LZ). D Dot plots of CD11b+ F4/80+ peritoneal macrophages of 8- to 12-week old WT, Casp8ΔE385/ΔE385 and Ripk1+/−Ripk3−/−Casp8ΔE385/ΔE385 mice. Bars, mean + SD. P values (unpaired, two-tailed t test) ****p < 0.0001.

