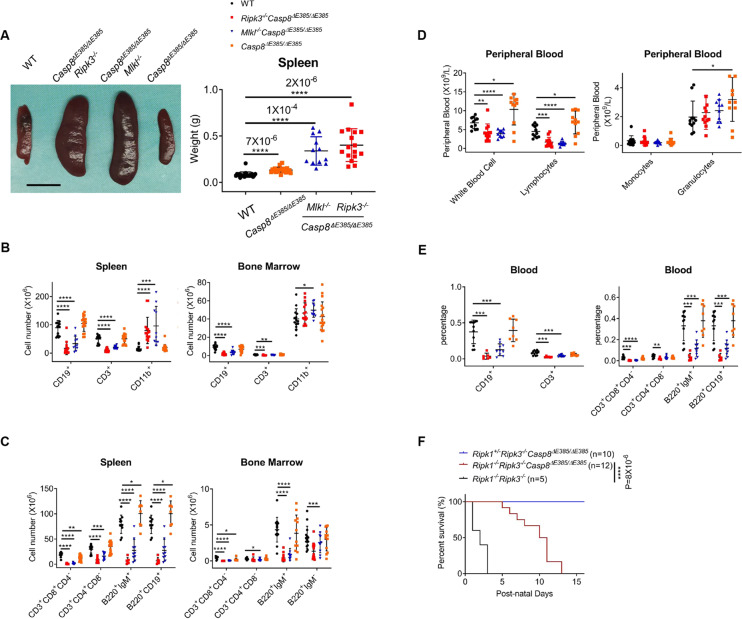
Fig. 5. Casp8ΔE385/ΔE385Ripk3−/− mice develop serious lymphopenia and myeloid bias but prevent the postnatal lethality of Ripk1−/− mice.
A Spleens images (15 week) (left) and total spleen weight (14- to 17-week old) (right) of the indicated genotype mice. Scale bar, 1 cm. Bars, mean ± SD. P values above the asterisk (unpaired, two-tailed t test) ****p < 0.0001. B The immunocytes cell number in spleen and bone marrow (per tibia and femur) of 14- to 17-week old mice. Bars, mean ± SD. P values (unpaired, two-tailed t test) *p < 0.05, **p < 0.01, ***p < 0.001, ****p < 0.0001. C The B cell and T cell subsets cellularity in spleen and bone marrow (per tibia and femur) of 14- to 17-week old mice. Bars, mean ± SD. P values (unpaired, two-tailed t test) *p < 0.05, **p < 0.01, ***p < 0.001, ****p < 0.0001. D The absolute cell number of the white blood cells and their subsets in the peripheral blood of 14- to 17-week old mice. Bars, mean ± SD. P values (unpaired, two-tailed t test) *p < 0.05, **p < 0.01, ***p < 0.001, ****p < 0.0001. E The B cell and T cell subsets cellularity in the peripheral blood of 14- to 17-week old mice. Bars, mean ± SD. P values (unpaired, two-tailed t test) **p < 0.01, ***p < 0.001, ****p < 0.0001. F Mouse survival curve of the given genotypes after birth. P values alongside the asterisk, two-sided Log-rank (Mantel-Cox) test, ****p < 0.0001.

