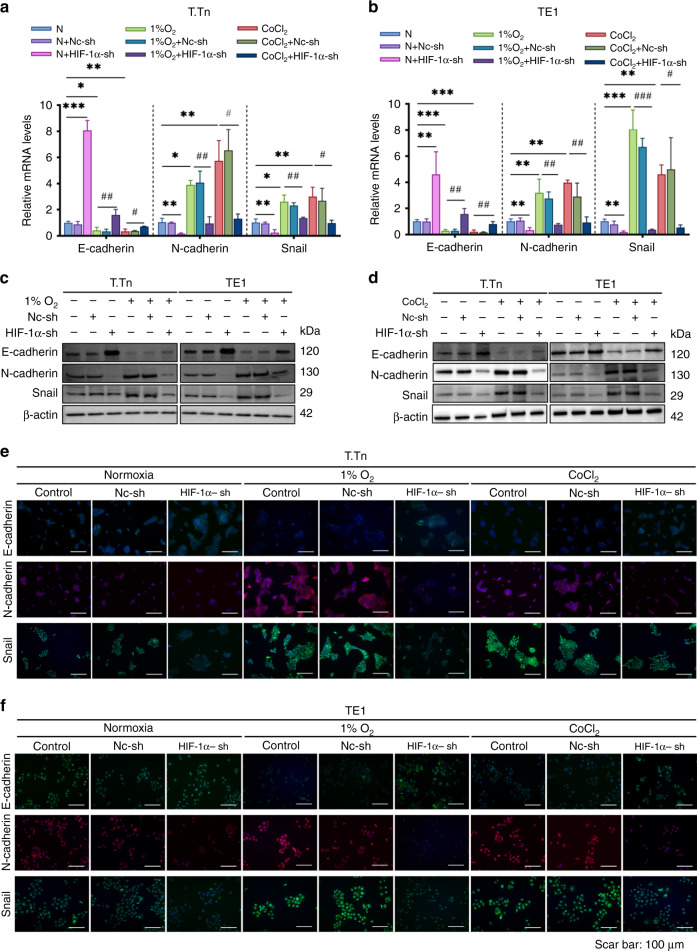
Fig. 3. HIF-1α was involved in hypoxia-induced EMT activation in T.Tn and TE1 cell lines.
T.Tn and TE1 cells with or without HIF-1α knockdown were cultured under normoxia, 1% O2 (T.Tn, 24 h; TE1, 12 h) exposure, and CoCl2 (100 μM, 24 h) treatment. The mRNA (a, b) and protein (c, d) levels of E-cadherin, N-cadherin and Snail of the indicated T.Tn and TE1 cells. e, f The expression of E-cadherin, N-cadherin and Snail in the indicated T.Tn and TE1 cells, were detected using immunofluorescence. E-cadherin and Snail were stained green, N-cadherin was stained red, and the nuclei were stained blue with DAPI. Data were normalised to normoxia. All data represent mean ± SD of three independent experiments. *P < 0.05, **P < 0.01, ***P < 0.001 vs normoxic baseline. #P < 0.05, ##P < 0.01, ###P < 0.001 vs hypoxic (1% O2, CoCl2) baseline. Scar bar: 100 μm. N normoxia, Nc-sh negative control shRNA, HIF-1α-sh HIF-1α-shRNA.

