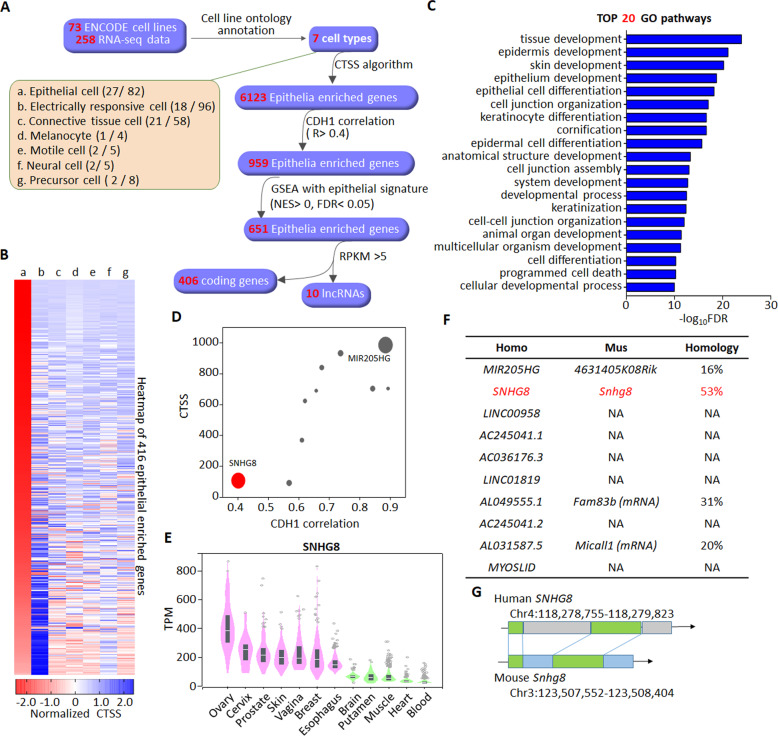
Fig. 1. CTSS-based screening of epithelial cell-enriched lncRNAs.
A Scheme of the screening process of epithelia-specific lncRNAs. The 73 cell lines recorded by ENCODE are classified into 7 cell types as indicated by a-g according to their cell ontology annotations. The numbers of cell lines and corresponding RNA-seq data in each cell type are shown in the parentheses. Following the CTSS screening of cell-type enriched genes, the resultant 6123 epithelia-enriched genes were further filtered by the correlation with CDH1 (Pearson R > 0.4), GSEA analysis with epithelial signature (NES, normalized enrichment score, NES > 0, false discovery rate, FDR < 0.05) and RPKM > 5, yielding a final list of 406 coding genes and 10 lncRNAs. B Heatmap depicting the CTSSs of the 416 epithelia-enriched genes across different cell types as indicated by group a-g like panel A. Genes are ranked based on the normalized CTSSs in epithelial cells. C Top 20 GO biological processes enriched by the 406 epithelia-enriched coding genes. D Scatter plot depicting the CTSSs and correlations with CDH1 of the 10 epithelia-enriched lncRNAs. The size of the dot represents the average RPKM. E The level of SNHG8 in indicated normal tissues from GTEx was analyzed by GTEx portal website (https://www.gtexportal.org). Expression values are shown in transcripts per million (TPM) calculated from a gene model with isoforms collapsed to a single gene. Box plots are shown as median and 25th and 75th percentiles; points are displayed as outliers if they are above or below 1.5 times the interquartile range. F Table summarizing the homology of indicated lncRNAs with corresponding mouse analogs. NA not applicable. G The homology sequence analysis depiction of SNHG8 and its conserved analog in mouse. The green regions are highly conserved.

