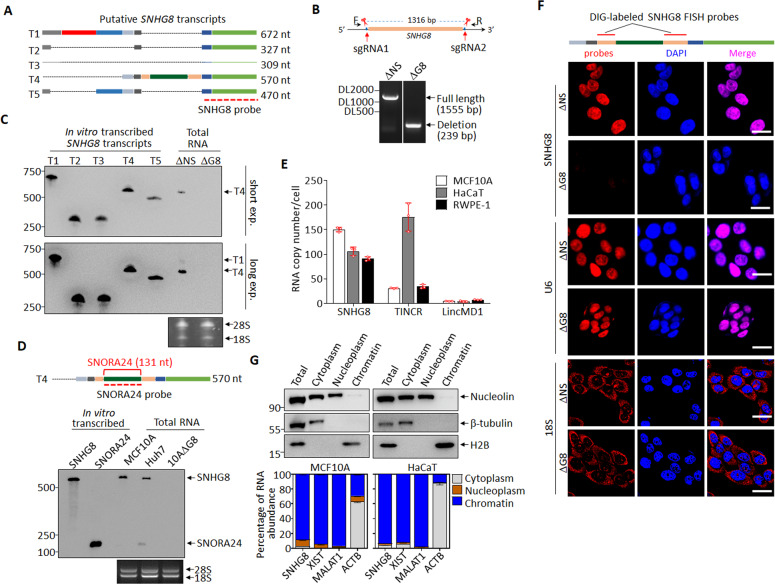
Fig. 2. Characterization of SNHG8 in epithelial cells.
A Schematic diagram of putative SNHG8 transcripts (data from Ensembl database), with the SNHG8 probe for Northern blot indicated. B Schematic diagram of guide RNAs (sgRNA1 and sgRNA2) targeting SNHG8 gene loci and electrophoresis of the SNHG8 genomic PCR products. C Northern blots with SNHG8 probe in total RNA extracts from MCF10A-ΔNS and MCF10A-ΔG8 cells, with 1 ng in vitro transcribed putative SNHG8 transcripts (T1-T5) used as positive controls, and 28S/18S used as total RNA loading controls. D Schematic diagram of SNHG8 (T4), with SNORA24 and the SNORA24 probe indicated (top). Northern blots with SNORA24 probe in total RNA extracts from MCF10A and Huh7 cells, with 0.3 ng in vitro transcribed putative SNHG8 (T4) and SNORA24 transcripts used as positive controls, and 28S/18S used as total RNA loading controls (bottom). E The average copy numbers of SNHG8, TINCR and LincMD1 per cell in MCF10A, RWPE-1 and HaCaT cells as quantified by absolute qRT-PCR. F Schematic diagram of SNHG8 with probes used for DIG-labeled RNA-FISH assay indicated (Top). Representative confocal microscopy images of SNHG8 detected by Digoxin-labeled RNA-FISH assay with U6 snRNA and 18S RNA respectively as nuclear and cytoplasm RNA controls in MCF10A-ΔNS and MCF10A-ΔG8 cells. Scale bar, 20 μm. G MCF10A and HaCaT cells were fractionated and subjected to immunoblotting (top) and qRT-PCR (bottom) for the indicated proteins and RNAs. For immunoblotting, β-tubulin, Nucleolin, and H2B were respectively used as cytoplasm, non-chromatin, and chromatin markers; for qRT-PCR, XIST and MALAT1 were used as chromatin markers, and β-actin mRNA (ACTB) as cytoplasm marker. Data in panels E and G are the mean ± SD (n = 3), and all experiments were repeated for three times with similar results.

