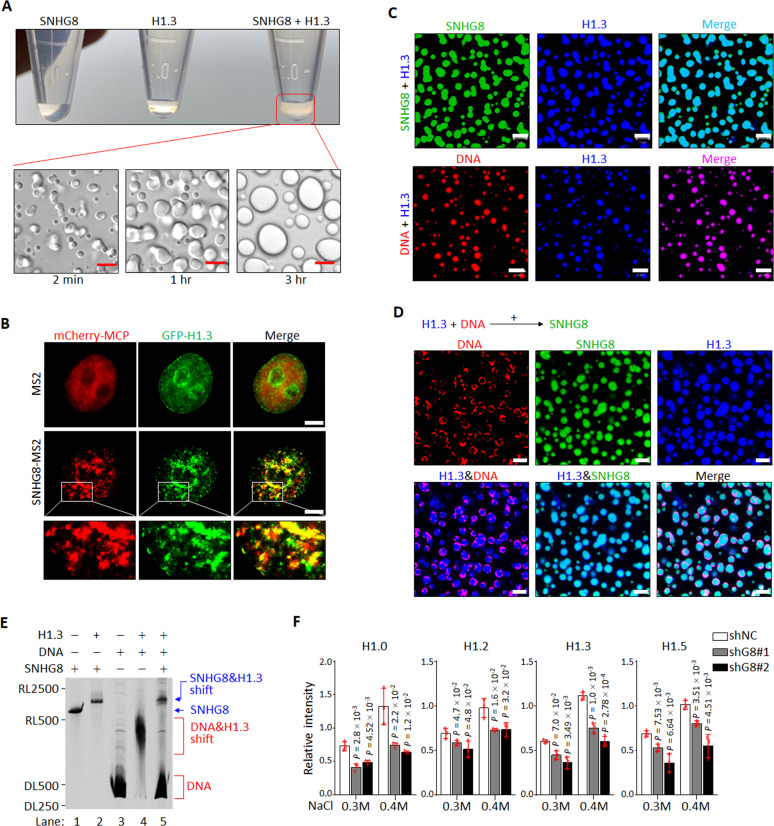
Fig. 4. SNHG8 competes with DNA for histone H1 binding.
A Photographs of tubes containing in vitro-transcribed SNHG8, recombinant H1.3 or SNHG8−H1.3 mixture (top), and images of turbid SNHG8−H1.3 mixture observed by differential interference contrast confocal microscopy (bottom). Scale bar, 5 μm. B MCF10A cells stably expressing GFP-tagged H1.3 and mcherry-MCP were transfected with MS2 or MS2-SNHG8 and subjected to living cell imaging under a confocal microscopy. Scale bar, 5 μm. MCP, MS2 coated protein. C Representative confocal microscopy images of fluorescein-labeled SNHG8 (green) or AF594-labeled p601 DNA (red) mixed with AF647-labeled H1.3 (blue) in 150 mM NaCl by molecular ratio 1:1. Scale bar, 5 μm. D Fluorescein-labeled SNHG8 (green) was added to the pre-mixed AF647 labeled H1.3 (blue)−AF355-labeled p601 DNA (red) mixture, followed by incubation for 30 min. Representative confocal microscopy images were shown. Scale bar, 5 μm. E In vitro electrophoretic mobility shift assay showing the competitive relationship between SNHG8 and p601 DNA for H1.3. F Quantification of salt extraction assays showing the relative intensity of each H1 variant extracted by increasing salt concentrations from MCF10A cells with and without knockdown of SNHG8. Data are the mean ± SD (n = 3), and P values compared with shNC cells were calculated by multiple T-test corrected by Bonferroni–Dumn method. All experiments were repeated for three times with similar results.

