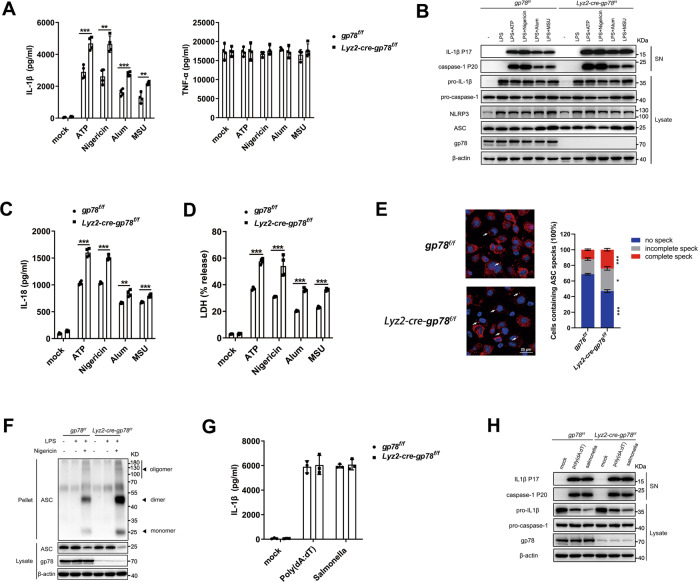
Fig. 1. Loss of gp78 enhances NLRP3 inflammasome activation in macrophages.
A, B ELISA analysis of supernatant (SN) for IL-1β and TNF-α release (A, n = 4.), and immunoblots of SN (B) in lysates from peritoneal macrophages from gp78f/f and Lyz2-cre-gp78f/f mice primed with LPS (500 ng/ml) for 4 h and treated with ATP (2 mM) or nigericin (10 μM) for 30 min and alum (300 μg/ml) or MSU (200 μg/ml) for 5 h. C, D ELISA analysis of IL-18 production (C) and LDH release (D) from SN of peritoneal macrophages from gp78f/f and Lyz2-cre-gp78f/f mice primed with LPS (500 ng/ml) for 4 h and treated with ATP (2 mM) or nigericin (10 μM) for 30 min and alum (300 μg/ml) or MSU (200 μg/ml) for 5 h. N = 4. E Arrows showing ASC specks immunofluorescence in bone-marrow-derived macrophages from gp78f/f and Lyz2-cre-gp78f/f mice primed with LPS (500 ng/ml) for 4 h followed by treatment with 10 μM nigericin for 45 min (scale bar, 20 μm) (left). Quantification of ASC speck formations (right). F Immunoblots of ASC oligomerization in cross-linked cytosolic pellets from peritoneal macrophages from gp78f/f and Lyz2-cre-gp78f/f mice primed with LPS (500 ng/ml) for 4 h followed by treatment with 10 μM nigericin for 45 min. G, H ELISA analysis of SN for IL-1β release (G, n = 3) and immunoblots of SN (H) in lysates of peritoneal macrophages from gp78f/f and Lyz2-cre-gp78f/f mice primed with LPS (500 ng/ml) for 4 h followed by treatment with Salmonella or poly(dA:dT) transfection for 1 h. *p < 0.05, **p < 0.01, ***p < 0.001. Values are mean ± SD (A, C, D, G), mean ± SEM (E). Data are representative of three independent experiments.

