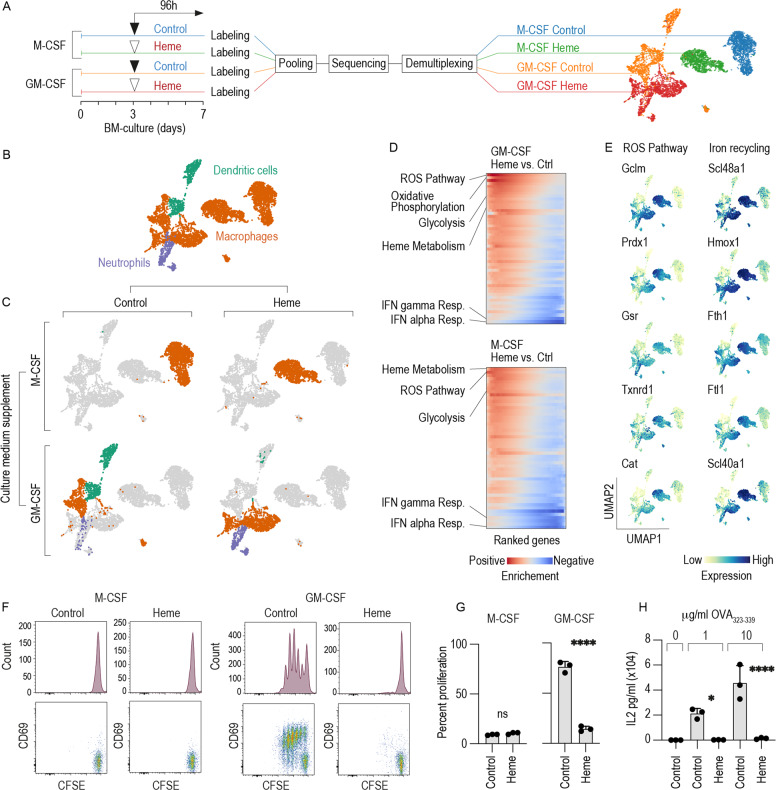
Fig. 1. Heme exposure suppressed CD11c+/MHC class IIhigh/CD115 (Csf1R)− DC phenotype and function in GM-CSF mouse BM cultures.
A Left: Outline of the multiplexed scRNA-seq experiment. M-CSF- and GM-CSF BM cultures were stimulated with heme (300 µM) or vehicle on day 3. On day 7, the cells were harvested, tagged with oligo-barcoded antibodies, and pooled into a single scRNA-seq sample for sequencing. Demultiplexing and reassignment of treatment groups were performed after quality assessment, filtering, and cell-type attribution. Right: UMAP plot showing cells colored by DNA-barcoded antibodies (hashtag labeling). B UMAP plot showing cells colored by cell type. C Factorial UMAP plots of the dataset separated by culture supplement (M-CSF versus GM-CSF) and treatment condition (vehicle versus heme exposure). The data points are colored by cell type (orange = macrophages, purple = neutrophils, green = DCs). D GSEA of differentially expressed genes (heme exposure versus vehicle) in GM-CSF or M-CSF BM cultures. The heatmaps represent the running enrichment score per gene-set category (red for positive enrichment, blue for negative enrichment). Each row represents one gene-set category. E UMAP plots showing the expression levels of the top five enriched genes defining the ROS pathway and genes associated with iron recycling in the whole data set. F M-CSF- and GM-CSF BM cells were cultured with heme (300 µM) or vehicle. On day 7, the cells were harvested, pulsed with OVA323-339 (1 µg/ml), washed to remove any remaining heme, and then incubated with CFSE-labeled naive CD4+ T cells isolated from OT-2 mice in a 1/5 BM cells to T cells ratio. The proliferation of CD4+ T cells was assessed by evaluating the degree of CFSE dilution measured by flow cytometry after 3 days in coculture. The cells were also stained for the T cell activation marker CD69. Representative data for cells gated based on positive CD4 expression are shown. G Cumulative T cell proliferation data from three independent coculture experiments. H GM-CSF BM cells were cultured with heme (300 µM) or vehicle. On day 7, the cells were harvested, pulsed with OVA323-339 (1 or 10 µg/ml), washed to remove any remaining heme, and then incubated with CFSE-labeled naive CD4+ T cells. The proliferation of CD4+ T cells was assessed after 3 days in coculture by flow cytometry. Cumulative T cell proliferation data from three independent coculture experiments are shown. The data in G, H are presented as the means ± SDs. Each dot represents one independent experiment. t-test (G); one-way ANOVA with Tukey’s multiple comparison test (H); n.s. not significant, *P ≤ 0.05, **P ≤ 0.01, ***P ≤ 0.001, ****P ≤ 0.0001.

