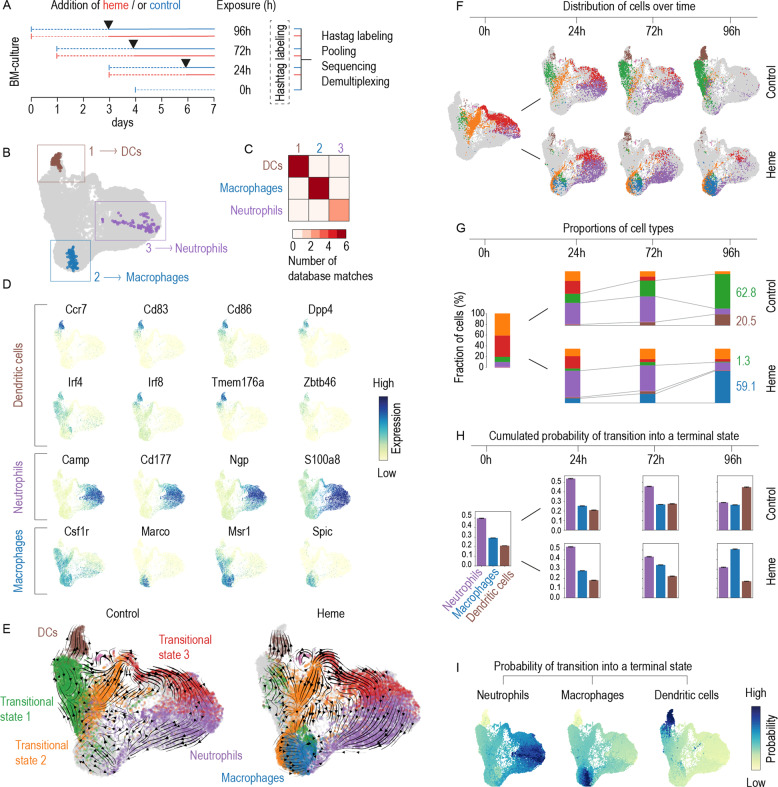
Fig. 2. Heme redirects the cell differentiation pathways in GM-CS mouse BM cultures from DCs towards macrophages.
A Outline of the multiplexed scRNA-seq experiment. GM-CSF BM-cultures were initiated on day 0, 1, 3, and 4. Each culture was treated with heme (300 µM) or vehicle control (black arrows) on day 3 and cells were harvested on day 7 providing heme exposure periods of 0, 24, 72, and 96 h. After, the cells were harvested, tagged with DNA-barcoded antibodies, pooled, and processed for sequencing. After quality assessment, filtering, and cell-type attribution, the experiment was demultiplexed to reassign individual cells to their sample of origin. A UMAP plot of the scRNA-seq results highlighting the cells that were automatically selected by the CellRank algorithm as most representative of one of three, yet undefined, terminal differentiation states (1 brown, 2 blue, 3 violet). The terminal state-typical cell populations selected in B were used in a similarity search against >15 million annotated cells from published studies. Similarity matching was performed using CellSearch (Bioturing). For each macrostate (1, 2, or 3), the heatmap shows the number of high-quality matches for DCs, macrophages, and neutrophils that were then used for cell-type attribution. C Expression intensity projections of the scRNA-seq data showing canonical marker genes for cDCs, neutrophils, and macrophages. D UMAP plots of the scRNA-seq data separated by treatment status (control and heme). The superimposed arrows indicate RNA velocity vectors that were calculated for each treatment condition across time points. The colors represent the three terminal states and three additional transition states. The macrostate colors will be used for the remainder of the figure. E UMAP plots of the scRNA-seq data separated by heme treatment status and time point illustrate the treatment-dependent differentiation pathways across the four time points. F Stack bar charts illustrating discrete cell-type attributions as a proportion of the whole number of cells per sample, for each time and treatment condition. Numbers are percentages. G Cumulative absorption probabilities summarizing the probability of each cell reaching each terminal state defined as DCs, macrophages, and neutrophils given for each time point for both experimental conditions. H UMAP plots with the cells colored according to their probability of reaching the terminal state defined as DCs, macrophages, or neutrophils. Data of all treatment conditions (heme × time) are merged.

