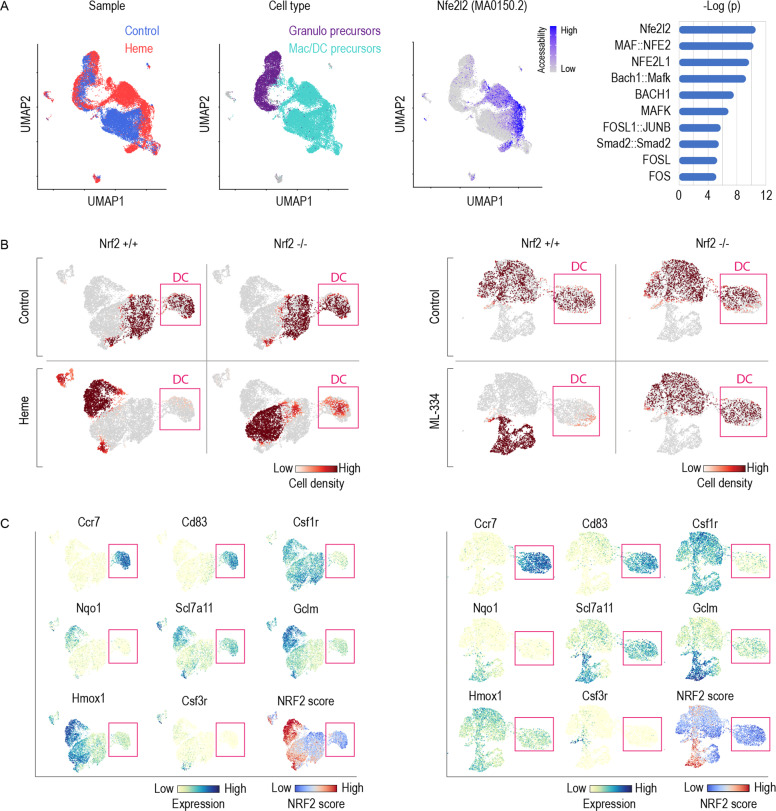
Fig. 3. Heme activates NRF2 and its signaling impaired DC differentiation in GM-CSF mouse BM cultures.
A Single-cell ATAC-seq experiment of GM-CSF BM precursors treated with heme (300 µM) or vehicle on day 3 for 6 h. From left to right, UMAP plots with cells colored by treatment, by cell-type and by Nfe2l2 motif (MA0150.2) activity score computed using chromVAR. Cell type was attributed based on the pseudogene expression of each cell for Mertk, Mrc1, and S100a9. Right: Top 10 overrepresented transcription factor motifs in differentially accessible regions in heme versus vehicle-treated cells. B Factorial scRNA-seq analysis of GM-CSF BM cultures performed with BM from Nrf2+/+ and Nrf2−/− mice. The UMAP plots are colored to represent the cell densities (red) for each experimental condition (left panel: control, heme; right panel: control, ML-334). Pink box highlights DC population. This illustration indicates that heme and ML-334 suppress the generation of DCs in Nrf2+/+ but not Nrf2−/− BM cultures. C Expression intensity projections of selected marker genes in combined Nrf2+/+ and Nrf2−/− BM cells treated with vehicle/heme (left) or vehicle/ML-334 (right). DCs were identified as the Ccr7high, Cd83high, and Csf1r− cell population (highlighted by pink box). The UMAP on the lower right displays the scored expression of the full Nrf2-regulated gene set from the TRRUST gene-set library. A high NRF2 score was detected in Nrf2+/+ cells treated with heme or ML-334.

