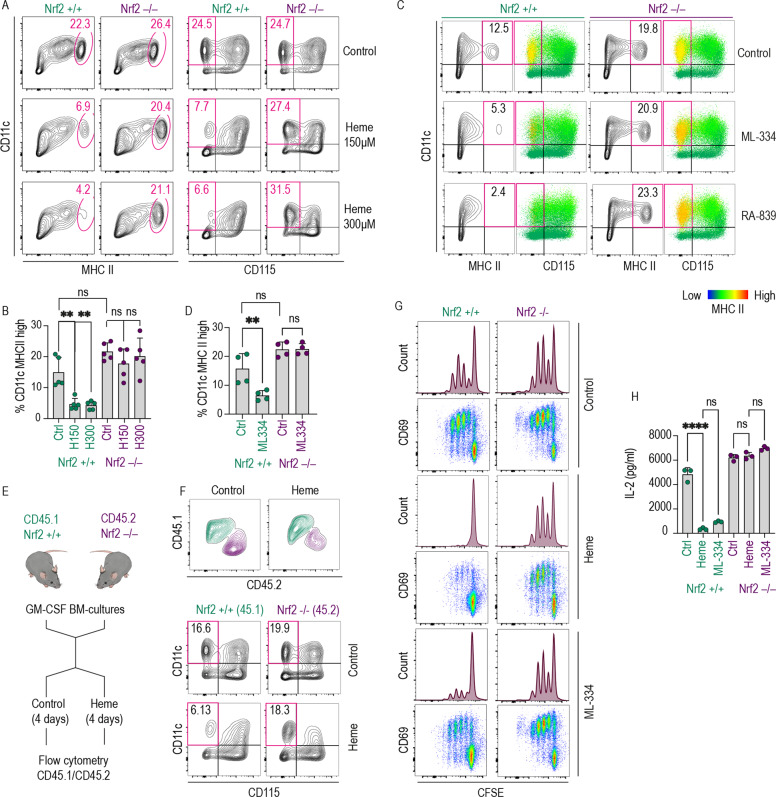
Fig. 4. The emergence of functional DCs was suppressed by cell-intrinsic heme-NRF2 signaling in GM-CSF mouse BM cultures.
A Flow cytometry contour plots of Nrf2+/+ and Nrf2−/− GM-CSF BM cultures treated with heme (150 or 300 µM) or vehicle for 96 h (culture days 3–7). Based on the scRNA-seq data shown in Fig. 1, we defined DCs in this culture as CD11c+/MHC class IIhigh or CD11c+/CD115− (boxed in red). B Proportion of DCs defined as CD11c+ MHC class IIhigh across treatment conditions and genotypes. C Flow cytometry contour plots of Nrf2+/+ and Nrf2−/− GM-CSF BM cultures treated with the Nrf2 activator ML-334 (10 µM) or RA-839 (15 µM) for 96 h. The data illustrate the Nrf2-dependent depletion of MHC class IIhigh (yellow) cells in the CD11c+ CD115− population. D Proportions of DCs defined a CD11c+ MHC class IIhigh across treatment conditions and genotypes. E Outline of BM coculture experiments: Nrf2−/− (CD45.2) and wild-type (CD45.1) BM cells were cocultured in the same dish and treated with heme-albumin or vehicle for 96 h. During the final analysis, the original genotype of each cell was assigned by flow cytometric analysis of the congenic CD45.1/CD45.2 markers. F Flow cytometry contour plots of a representative coculture experiment. Heme exposure leads to selective depletion of CD11c+ CD115− DCs in the wild-type (CD45.1) cell population but not in the Nrf2-knockout cell population. G Nrf2+/+ and Nrf2−/− GM-CSF BM cultures treated with vehicle, heme-albumin (150 µM), or ML-334 (10 µM) for 96 h were pulsed with OVA323-339 (1 µg/ml), washed to remove heme and excess peptide, and cocultured with CFSE-labeled OT-2 CD4+ T cells. The dilution of CFSE after 4 days was measured by flow cytometry. The cells were also stained for the T cell activation marker CD69. Representative data for cells gated based on positive CD4 expression are shown. H IL-2 concentration in supernatants of coculture experiments as described in G. The IL-2 concentration was measured using a Bio-Plex assay. The data in B and D, and H are presented as the means ± SDs. Each dot represents one independent experiment. The data in F are representative of two independent experiments, and the data in G are representative of six independent experiments. The data presented in B, D, and H were analyzed by one-way ANOVA with Tukey’s multiple comparison test. n.s. not significant, *P ≤ 0.05, **P ≤ 0.01, ***P ≤ 0.001, ****P ≤ 0.0001.

